Information Technology Reference
In-Depth Information
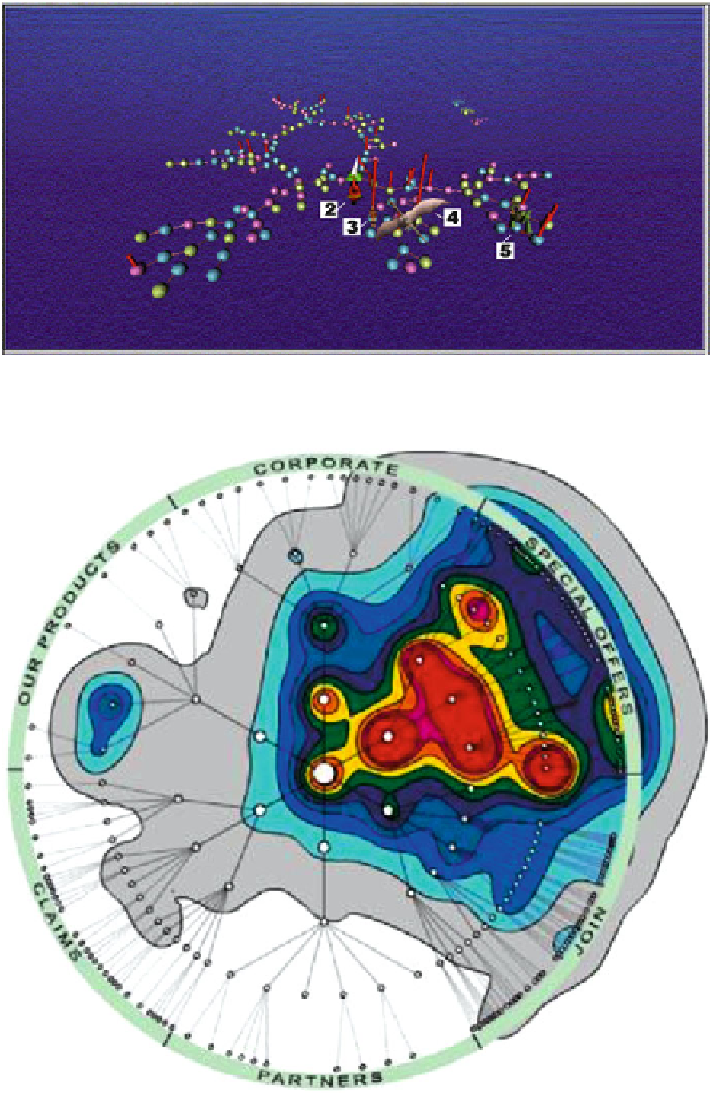
Fig. 4.4
More users gathering in the scene
Fig. 4.5
A site map produced by see POWER. The
colored contours
represent the hit rate of a
web page. The home page is the node in the center (Courtesy of
http://www.compudigm.com/
)
Search WWH ::

Custom Search