Information Technology Reference
In-Depth Information
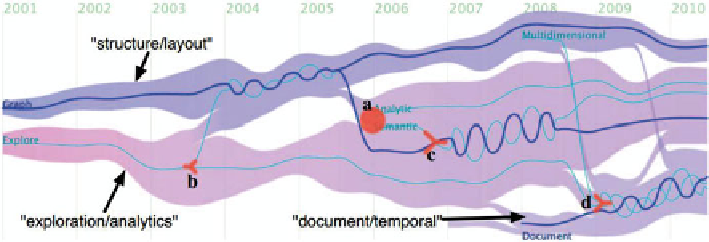
Fig. 3.17
The evolution of topics is visualized in TextFlow (Reprinted from Cui et al.
2011
)
The height of a layer of a movie, or the width of the stream, indicates the weekly box
office revenue of the movie. Its color indicates its level in terms of the total domestic
gross up to Feb. 21, 2008, the cut-off date of the data. According to the visualization,
the most popular movies in 2007 include
Transformers
,
Harry Potter and the Order
of the Phoenix
,
IamLegend
,and
National Treasure: Topic of Secretes
.Thecolorof
National Treasure
indicates that its total domestic gross is one level below
Iam
Legend
.
The idea of using the variation of a thematic stream to reveal topic evolution
is appealing because it is intuitive and easy to understand. On the other hand,
computationally identifying a topic from unstructured text remains to be a challenge.
Identifying the evolution of a topic is an even more challenging subject. Research
in topic modeling has advanced considerable over the past decade. A good example
of integrating topic modeling and information visualization to address the ability to
track the evolution of topics over time is TextFlow (Fig.
3.17
).
TextFlow follows the thematic river metaphor but extends the metaphor with
features that are more suitable for analyzing the evolution of topics. TextFlow adopts
the use of the width of a stream to indicate its strength. It addresses some of the
most common dynamics between streams, for example, how a stream splits into
multiple streams and how a few streams merge into a single stream. These patterns
of dynamics are of particular interest in analyzing the development of a subject
domain. Another remarkable aspect of TextFlow is how it presents a seemingly
simplistic display of a complex issue.
3.2.5.2
Alluvial Maps
My favorite design of timeline visualization is that of alluvial maps by Martin
Rosvall. Martin Rosvall maintains a website so that one can generate alluvial maps
for their own network data.
3
To generate an alluvial map, the alluvial generator
needs to have a series of networks as the input. Each network corresponds to the
Search WWH ::

Custom Search