Information Technology Reference
In-Depth Information
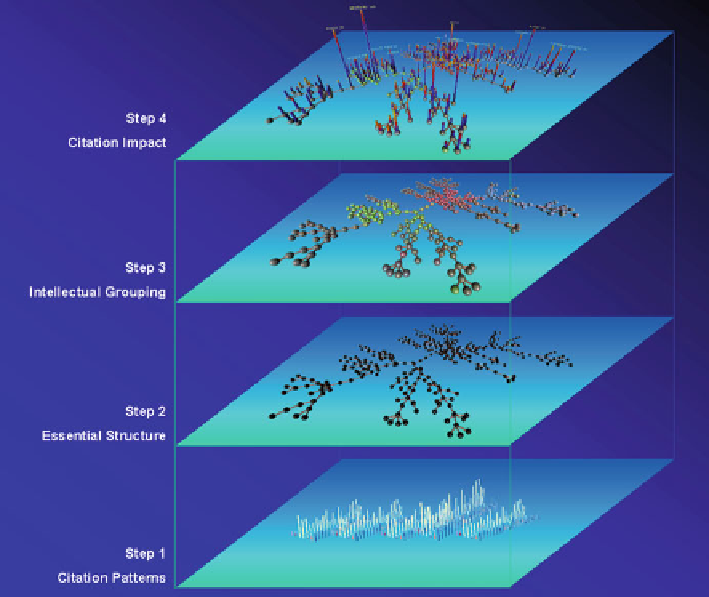
Fig. 3.13
The process of visualizing citation impact in the context of co-citation networks (© 2001
IEEE)
3.2.4.4
Constructing a Virtual World of Scientific Literature
Now we give a brief introduction to the use of techniques for mapping. A more
detailed analysis from co-citation points of view is in the next chapter. Figure
3.13
illustrate the process of structuring and visualizing citation impact in the context
of co-citation networks. Indeed, the process is very generic, applicable to a wide
spectrum of types of phenomena.
First, select authors who have received citations above a threshold. Intellectual
groupings of these authors represent snapshots of the underlying knowledge do-
main. Co-citation frequencies between these authors are computed from a citation
database, such as ISI's SCI and SSCI. ACA uses a matrix of co-citation frequencies
to compute a correlation matrix of Pearson correlation coefficients. According to
(White and McCain
1998
), such correlation coefficients best capture the citation
profile of an author.
Search WWH ::

Custom Search