Information Technology Reference
In-Depth Information
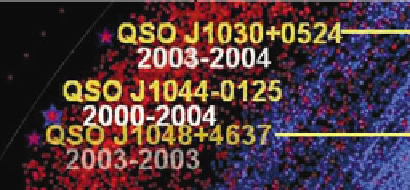
Fig. 2.30
SDSS quasars
associated with citation bursts
Fig. 2.31
A network of co-cited publications based on the SDSS survey. The
arrow points
to an
article published in 2003 on a survey of high redshift quasars in SDSS II. A citation burst was
detected for the article
Figure
2.31
shows the literature resulted from the SDSS survey. Each dot
represents a published article. The size of the tree-ring indicates the citations
received by the corresponding article. The yellow arrow points to an article by Fan
et al. in
2003
on a survey of high redshift quasars in SDSS II, the second stage of
the SDSS project. The article was found to have a burst of citations, indicating the
attention it attracted from the scientific community. In later chapters in this topic,
we will discuss this type of literature visualization in more detail.
The SDSS example has practical implications on science mapping. First, as-
tronomy provides a natural framework to organize and display the large amount
of astronomical objects. The distance between a high redshift quasar and the Earth
is meaningful. It can be precisely explained in scientific terms. The mission of the
scientific frontier in this context is to understand the early universe. The attention
of the research frontier is clearly directed to the high redshift quasars because they
were formed soon after the Big Bang. An intuitive indicator of the progression of the
frontier is the look-back time, i.e. how closely objects formed after the Big Bang can
be observed. The structure of the universe in this case provides an intuitive reference

Search WWH ::

Custom Search