Image Processing Reference
In-Depth Information
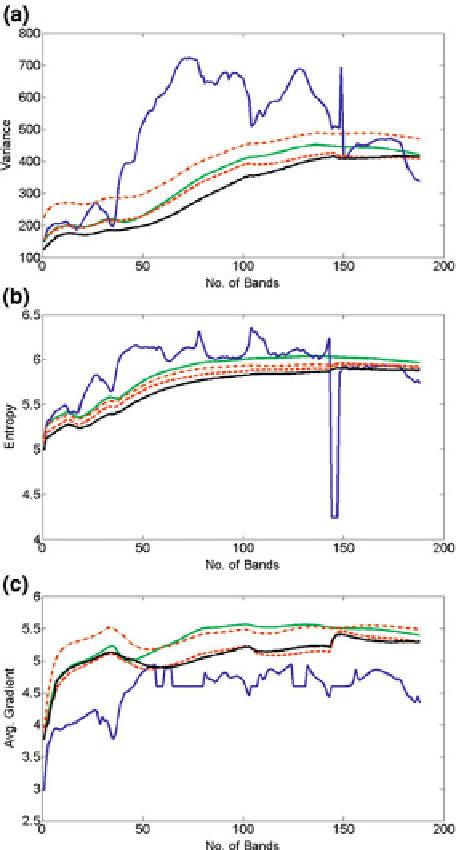
Fig. 9.1
Quality assessment
for various techniques for
fusion of hyperspectral data
with no reference measures
for the moffett
2
dataset from
the AVIRIS. The legends are
as follows: Blue (continuous)
lines represent the technique
of three-band selection. Green
lines represent the bilateral
filtering technique. Color
matching function technique
is represented by dashed red
lines, while dashed brown
lines are indicators of the
MRA-based technique. Black
(continuous) lines represent
the piecewise linear function
technique. (Color is viewable
in e-book only.)
a
Variance.
b
Entropy.
c
Average gradient
( c
2011 Elsevier, Ref: [92])
Figures
9.3
and
9.4
represent the plots of the performance measures for the geo-
logical image from the Hyperion. The nature of the performances for variance and
entropy measures can be observed from Figs.
9.3
a, b. This monotonically increasing
nature of these no-reference measures is similar to the observations for the moffett
2
dataset. These plots highlight the uncorrelated nature of selected bands for synthe-
sis using the band selection technique. Further, it may be noticed that for both test
datasets, the performance of theMRA-based technique changes a bit unpredictably at
the beginning and then recovers as more bands are used. When the number of bands
is relatively lower, the changes in local weights used to combine the high frequency