Image Processing Reference
In-Depth Information
(a)
(b)
(c)
(d)
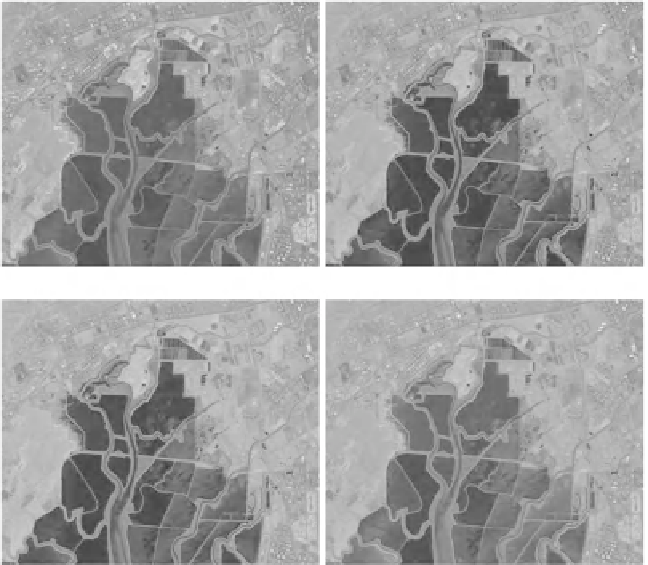
Fig. 8.4
Results of bilateral filtering-based fusion of the moffett
2
data from the AVIRIS applied
over a subset of bands selected using the output-based scheme.
a
-
d
show the results of fusion for
κ
values 0, 0.50, 0.65 and 0.75, respectively
as the reference fused image. The result of fusion of 110 bands of the moffett
2
data
is shown in Fig.
8.4
c where the threshold parameter
κ
was set to 0.65. Finally, the
resultant of fusion of 14 bands which are nearly
1
/
10
-th of the hyperspectral image
is shown in Fig.
8.4
d. These bands were obtained by choosing
κ
to be 0.75, and yet,
the fused image provides a PSNR of around 35 dB.
The Bhattacharyya distance is another measure for evaluation of the closeness
between two images. Our interest lies in evaluating the closeness between the fused
images obtained from the subset of the bands obtained from the output-based selec-
tion scheme, and the resultant image from fusion of the entire dataset, designated as
the reference image throughout our discussion. The Bhattacharyya coefficient is a
distance metric that indicates the degree of overlap between the histograms of two
images. The plot of the Bhattacharyya coefficient (BC) between the reference image
and the resultant images obtained from fusion of subset of bands selected using the
output-based scheme is shown in Fig.
8.5
. These subsets of hyperspectral bands are
obtained by varying the threshold parameter
, and subsequently fusing the bands
using the bilateral filtering-based technique. The Bhattacharyya coefficient (BC) can
be observed to gradually increase for increasing values of
κ
κ
beyond 0.50.

