Image Processing Reference
In-Depth Information
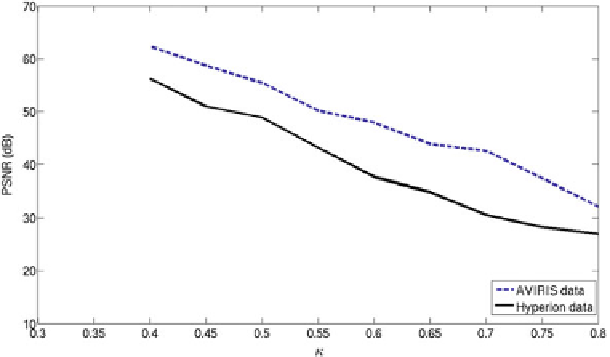
Fig. 8.3
Plots of PSNR of the fused images for various values of
κ
on the Hyperion and the AVIRIS
data using the bilateral filtering-based fusion technique over the subsets selected using the output-
based scheme. The resultant image from fusion of the entire dataset using the same technique is
used as a reference in each case
the reference image. Similar to the input-based band selection, the values of PSNR
drop very gradually when
65, this scheme selected 71
bands of the urban hyperspectral image which is nearly
κ
is increased. For
κ
=
0
.
1
/
3
-rd the entire dataset,
however, the fused image provides a PSNR above 30 dB which indicates a good
visual match between the two images. For the same value of
, 110 bands of the
moffett
2
data were selected, yielding the corresponding fused image with a PSNR of
nearly 43 dB. A PSNR above 40 dB can be observed in the resultant image generated
from fusion of only 12 bands when the threshold parameter
κ
is set to 0.70 in the
case of the moffett
2
hyperspectral image. This result compares very well with that
schemes of band selection provide a subset of bands which is capable of producing
comparable results with only a fraction of the data. Similar characteristic plots have
been observed for other pixel based fusion techniques also.
Although visual comparison is a subjective measure, it is often important, espe-
cially when the primary purpose of fusion is the visualization of scene contents by a
human analyst. We provide some of the output images resulting from fusion of sub-
sets of the moffett
2
hyperspectral image where the bands have been selected using
the output-based scheme. The fusion results of the output-based band selection are
provided in Fig.
8.4
. The images in Figs.
8.4
a-d are obtained from the subsets of
the moffett
2
data where the cardinality varies with relation to the variation in the
threshold parameter
κ
. Figure
8.4
a shows the result of fusion of the entire dataset,
and thus it acts as the reference for the evaluation purpose. Figure
8.4
b is the result
of fusion of 142 bands by setting
κ
40,
the band selection scheme does not discard any of the input bands, and hence the
fused images obtained for the values of
κ
to be 0.50. As for the values of 0
≤
κ
≤
0
.
κ
less than 0.40, are essentially the same