Game Development Reference
In-Depth Information
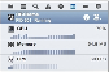
Debug Navigator
To access the debugging tools, you need to click the sixth icon on the left-hand side panel
icon bar, which usually shows a
Show the Debug Navigator
tool tip, and this will give
you direct access to the debugging tools.
Understand that accessing this panel without running a game on the device will show you a
totally empty panel. You must have a running game on the device to start seeing the tools
shown here:
The first part called
UE4Game
has general information about the game. It is not much, but
it is useful anyway. It gives you the
PID
value, which is the process ID of
601
, and the cur-
rent state of this process, which is obviously
Running
.
The second row of the toolset is the
CPU
. Accessing it will show you how many threads
the device is running at the moment, the performance of each thread, and the utilization of
each running process. Because you are running
UE4Game
, it will be the main focus here;
any other running processes on the device will be listed in
Other Processes
. The amount of
free CPU capacity will be listed in
Free percentage
.
Search WWH ::

Custom Search