Environmental Engineering Reference
In-Depth Information
300
Prediction based on
Equation 12.17
200
q
100
Triaxial compression
0
0
100
200
300
400
500
p'
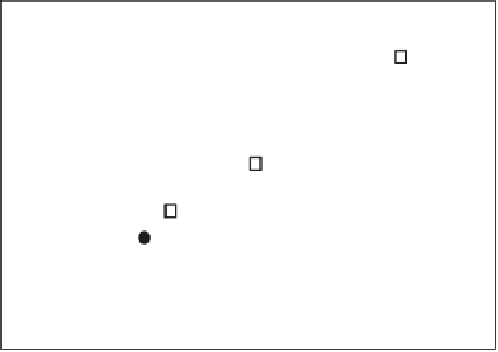
FIGURE 12.13
Relationships between
p
′ and
q
for actual triaxial compression and prediction. Units for both axes are in kPa.
the center and radius of the largest Mohr's circle in Figure 12.12b, respectively. This
p
′
-q
relationship is a tool that can be used for design of soil improvement.
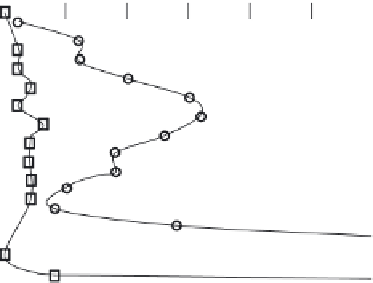
12.6.2.3 Cone Penetration Resistance
Figure 12.14 shows the change in cone penetration resistance (
N
sw
) as a result of microbial
cementation (carbonate content about 0.5% at a soil depth of 60 cm) of loose medium sand.
Figure 12.14 shows that penetration resistance increases because of carbonate cementa-
tion—i.e., the number of blows,
N
sw
—increases from approximately 10 to 70 at a soil depth
of 60 cm, and as one would expect, the number of resistance blows depends on the carbon-
ate content.
Number of blows (
N
sw
)
0
5
10
15
20
25
30
0
20
After precipitation
40
60
80
100
120
Before
140
160
FIGURE 12.14
Results of the dynamic cone penetration test for sand with and without microbial cementation.


Search WWH ::

Custom Search