Environmental Engineering Reference
In-Depth Information
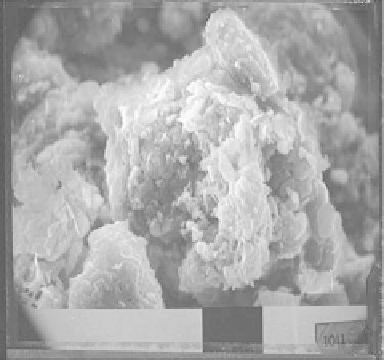
FIGURE 10.3
SEM picture showing typical aggregate grouping of particles forming the structure of a clay soil. The black
section of the band in the bottom center of the picture represents a scale of 10 μm. Note the variety and sizes
of voids, ranging from microvoids in the aggregate group (cluster, ped) to the macro voids between aggregate
groups of particles.
units. Because of the variety in sizes, we will use the general term
microstructural units
in
our discussion of the aggregate groups that make up the microstructure of the soils. The
importance of soil structure in deining low through a soil is evident from Figure 10.3.
Since low occurs through void spaces that are connected, the nature of the void spaces
and how these spaces are connected will be inluential in determining the low rate of the
liquid waste and contaminants. Greater densities of soil will show smaller void spaces.
Note that the micropores in the microstructural units will not show the same characteris-
tics of low as found in the macropores, i.e., the pores between peds. Because of the ininite
variations in sizes and types of microstructural units and their distribution, it would not
be surprising to ind that soils with similar compositions can have different densities and
correspondingly different hydraulic conductivities. If soil is to be used as a tool to control
low and distribution of contaminants—i.e., to mitigate contamination—it is important
to determine what key factors are involved in controlling contaminant partitioning and
distribution in the soil.
Soil permeability to liquids is determined as the hydraulic conductivity of a soil. This
holds true for saturated soils. However, for unsaturated soils, movement of liquids is gener-
ally identiied as diffusive low, even though this may not be exactly correct. The perme-
ability of a soil is generally expressed in terms of a permeability coeficient,
k
. The common
technique is to perform laboratory permeability tests, as shown, for example, in Figure
10.4, which depicts a constant head permeability test. Procedures for conducting permeabil-
ity tests using constant head and falling head techniques, and also with lexible wall per-
meameters have been written as Standards, e.g., ASTM D5084-03 (2003). Although the double
Mariotte tube system shown in Figure 10.4 is not the prescribed or speciied system for
administering the constant hydraulic head for permeameter tests, it is nevertheless a proper
and useful system to use. It permits lexibility in adjusting the hydraulic head required for
constant head permeation. The Darcy coeficient of permeability
k
is obtained from the rela-
tionship:
Q
=
kiA
=
k
(Δ
h
/Δ
L
)
A
. The hydraulic gradient
i
is the ratio of the hydraulic head Δ
h
and Δ
L
, the spatial distance, and
A
is the cross-sectional area of the test sample.
Search WWH ::

Custom Search