Environmental Engineering Reference
In-Depth Information
D
coecient in soil layer
Concentration of continuous
input of contaminants
D
coecient in soil layer
Year
N
1
Year
N
2
Year
N
3
Contaminant
concentration
profile
eoretical 100%
contaminant sorption capacity
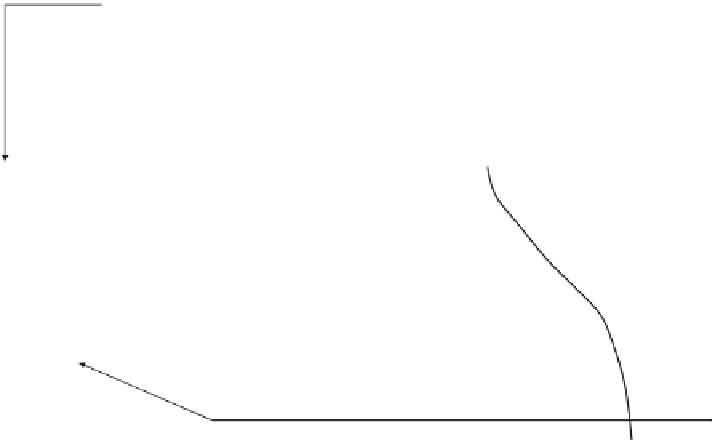
FIGURE 9.21
Illustration of contaminant concentration proiles in subsoil in relation to time elapsed given as years
N
n
.
Diffusion coeficient proile (right-hand curve) is obtained from calculations relecting changes in contaminant
concentration with time.
0
0.5
1
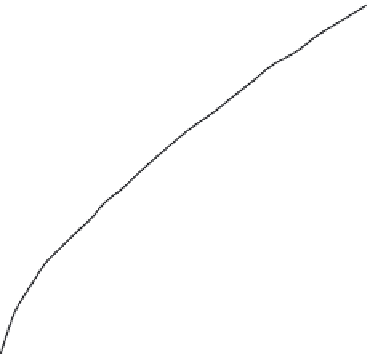
Initial chloride
Concentration = 3049 ppm
1.5
Numbers next to curves refer to
D
values
responsible for chloride concentration
profile after 25 years with units shown as:
D
= m
2
/s × 10
-10
2
2.5
0
20
40
60
80
100
Chloride concentration (mol/m
3
)
FIGURE 9.22
Effect of different values of coeficient of diffusion
D
on chloride concentration proile after 25 years of continu-
ous input of chloride at 3049 ppm.


Search WWH ::

Custom Search