Environmental Engineering Reference
In-Depth Information
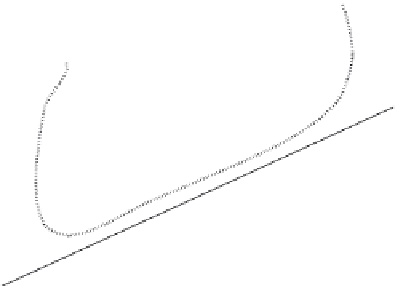
Contaminated
Concentration of normalizing element
FIGURE 8.8
Concept of a normalization technique for obtaining a background value.
that noncontaminated sediment samples are required in order that relationships between
normalized substances and the objective concentrations can be constructed. If the depth
and extent of sampling are insuficient, normalization characteristics cannot be obtained.
Many contaminants in water are sorbed on sorbates that may be inorganic and organic
particulate materials. These particulates, together with the sorbed contaminants eventu-
ally settle to form sediments on the seabed. The properties and surface characteristics
of the soil solids that comprise the particulate materials have been discussed briely in
Sections 2.4 and 2.5 in Chapter 2 in respect to contaminant-particle interactions. Some
of the more pertinent surface activities include such parameters as charge density, CEC,
speciic surface area, the equilibrium (natural) concentration of contaminants, etc. A more
detailed explanation of all of these surface properties and their interactions with contami-
nants can be found in Yong (2001). The background concentration values of sediments will
be directly related to the inherent properties and characteristics of the constituents.
There are two concepts of background concentration: (1) concentration in the mother
rocks and (2) mother rock concentrations together with sorbed substances under natural
conditions during transport process and deposition. The second concept is more appropri-
ate when background concentrations are used to evaluate the risk to human health, espe-
cially when bioconcentration is factored into risk evaluation.
8.4.5.1 Proile of Heavy Metal Concentration
Most proiles of metal concentration for sediments show trends similar to those portrayed
in Figure 8.9. The total concentration consists of the background and contributions from
the discharges originating from land-based industries. Beginning from the bottom of the
proile shown in Figure 8.9, the total concentration consists only of the background values.
As one progresses upward, toward the top of the sediment, the total concentration begins
to include contaminant discharge contributions from land-based industries. The begin-
ning point shown in the diagram assumes that this can be tied to the start of the Industrial
Revolution in about 1750. The total concentration increases as one progresses upward in
the sediment, indicating increased discharge of contaminants into the marine environ-
ment. As an example, Figure 8.10 shows zinc (Zn) concentrations in various sediments


Search WWH ::

Custom Search