Environmental Engineering Reference
In-Depth Information
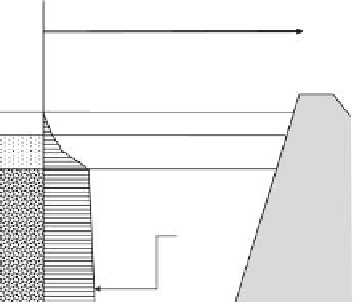
Increasing solids concentration
Supernatant
Transition zone
Stagnant zone
containing
recalcitrant
suspended solids
Solids
concentration
profile
Sediment
FIGURE 5.10
Illustration showing solids concentration proile for the recalcitrant suspended solids behavior pattern - typical
of such sludges and slimes as red muds, tar sands sludges, phosphatic, and other clay slimes.
Phosphate slime
sc ≈ 13 to 20%
Phosphate rock digestion, acidulation,
and wet process phosphoric acid
production, concentration, clarification
and superphosphate production.
Soil-organic slime
sc ≈ 2 to 20%
Wet milling of humate-cemented
sand grains for extraction of heavy
minerals.
Oil sands sludge
sc ≈ 40 to 44%
Sludge from hot water
extraction process for
bitumen from oil sands.
Bauxite red mud
sc ≈ 20 to 40%
Bayer processing of bauxite
for extraction of aluminium.
Beneficiation slurry
sc ≈ 8 to 10%
Discharge wash from extraction of
clay coated coal ore.
Aggregate slime
sc ≈ 12 to 18%
Wash-extraction of coarse
aggregates from weathered granite.
Tin mining slime
sc ≈ 48 to 54%
Gravel-pump mining discharge from
hydraulic mining of placer deposits.
Clay coating slurry
sc ≈ 50 to 54%
Clay coating slurries in kaolin mineral
processing for paper coating.
[
sc = solids concentration
]
FIGURE 5.11
Some examples of slurries, slimes, and sludge found in holding ponds. The solids concentrations (sc) are
obtained from results reported by Yong and his colleagues (see, for example, Yong, 1984). Details of the compo-
sitional features of the slurries, slimes, and sludge are given in Table 5.3.


Search WWH ::

Custom Search