Java Reference
In-Depth Information
Where there are discrepancies (i.e., the case was believed to be
nonfraudulent, but predicted to be fraudulent), there are opportu-
nities for investigation.
In fraud detection, we want to ensure we catch fraud (minimize
false negatives, which incorrectly identify fraud events as nonfraud
events), while avoiding investigating too many red herrings (mini-
mize false positives, which identify nonfraud events as fraud events),
since the costs associated with investigating fraud can be high.
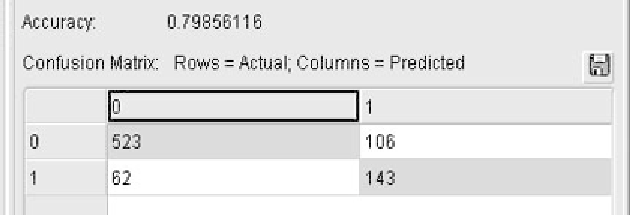
We digress briefly to discuss the types of errors possible for a
classification model. Figure 2-4 illustrates a typical report on predic-
tion accuracy, where
Type I error
is considered a false negative
prediction and
Type II error
is considered a false positive prediction.
The columns are labeled with the possible predicted classes, in this
binary case, “0” corresponds to the negative (nonfraud) prediction,
and “1” the positive (fraud) prediction. The value reported where
actual and predicted equals “1” indicates the number of times the
positive class was predicted correctly. Similarly, the value reported
where the actual and predicted equals “0” indicate the number of
times the negative class was predicted correctly. More than two val-
ues are possible when predicting multiple outcomes. In this case, the
matrix is
n
n
, instead of 2
2, where
n
is the number of possible
values.
Type I
Error
Type II
Error
Accuracy = Total Correct / Total Scored
= (523 + 143) / 834
= 666 / 834
= 0.7985
Figure 2-4
Assessing prediction accuracy via Type I and Type II error.
Source: Screen
capture from
Oracle Data Miner
graphical interface.


Search WWH ::

Custom Search