Java Reference
In-Depth Information
100
90
80
70
60
50
40
30
20
10
0
“Lift” due to
Data Mining
Random
selection response
10 20
30 40
50
60 70 80
90 100
% of Total Cases
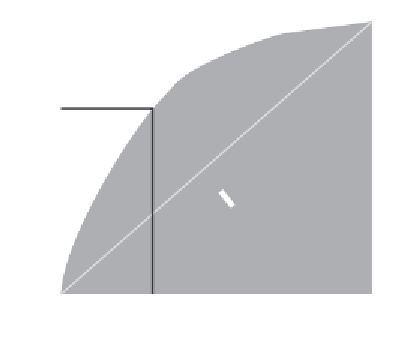
Figure 1-5
Cumulative positive targets representing model “lift.”
DMWHIZZ takes a 1 percent sample of customers for a trial
campaign. Reviewing the data from the 10,000 customers they
received their expected 2 percent, or 200 responses. Using the data
mining model and a held-aside or test set of customers, we find that
the model can return 80 percent of the likely responders contacting
only 40 percent of the customers, or 70 percent of likely responders
contacting 30 percent of the customers, as illustrated in Figure 1-5.
6
Armed with this information, DMWHIZZ data miners build a
classification model using customer demographic and other data in
their customer and sales databases. The resulting model is used to
predict the likelihood of response for each of the remaining 990,000
customers. Now, let's add up the results.
The cost of the trial campaign was $15,000 (10,000
$1.50). Using
the data mining model, DMWHIZZ scores the 990,000 customers and
takes the top 40 percent as likely to respond (400,000). Recall that this
model provides 80 percent of the likely responders within that
40 percent. Since we expect 20,000 responses out of a million custom-
ers, we should get 80 percent of these, or 16,000—less the 200 we
already received in the trial, or 15,800. At an average profit of $50 per
6
Note that predicting a customer's response is one aspect of the solution. Another
aspect is often profitability. This scenario can be augmented to predict profit per
customer and multiply by the probability of response, thereby producing an
expected profit per customer. Customers can be ordered based on this expected
profit.


Search WWH ::

Custom Search