Java Reference
In-Depth Information
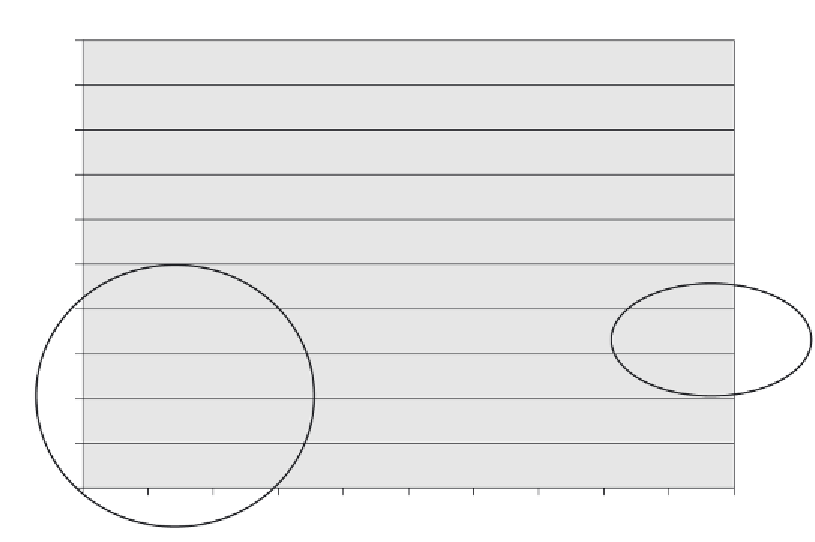
Cluster 2
C5
1
C4
0.9
0.8
0.7
0.6
Cluster 1
Cluster 3
0.5
C6
C10
0.4
C7
C1
0.3
C9
0.2
C8
0.1
C2
C3
0
0
0.1
0.2
0.3
0.4
0.5
0.6
0.7
0.8
0.9
1
Age
Figure 7-12
Customer clusters.
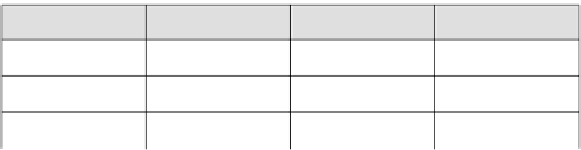
Table 7-12
Similarity matrix for credit-risk attribute
High
Medium
Low
High
1
0.5
0
Medium
0.5
1
0.25
Low
0
0.25
1
a similarity matrix can be expressed, as shown in Table 7-12. Here,
the diagonal values have similarity value 0 indicating that there is no
“distance” between two high values. Nondiagonal values can be set
as appropriate.
7.5.4
Use Model Details: Explore Clusters
Each cluster in a clustering model can have associated attribute
statistics and a rule that describes the cluster. Figure 7-13 illustrates


Search WWH ::

Custom Search