Java Reference
In-Depth Information
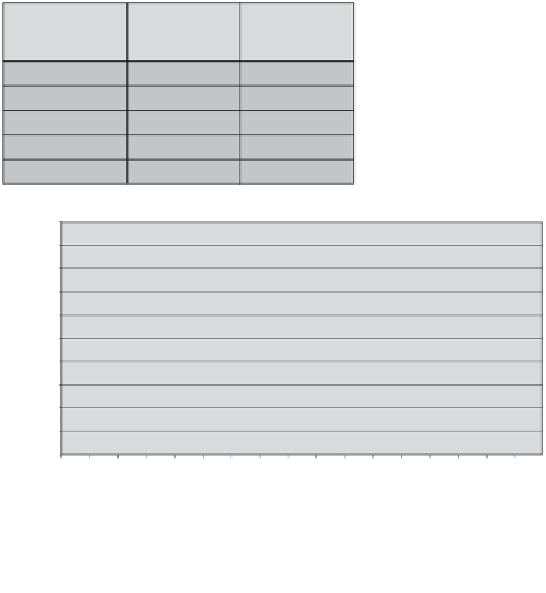
example, how effective each predictor attribute is at predicting the
target. Attribute importance results are often depicted graphically
using a bar chart. For example, Figure 4-3 illustrates the attribute
ranking available through JDM involving the attribute name, rank,
and importance value. A bar chart provides an immediate sense of the
relative importance of the attributes. Obviously, a higher ranked
attribute is more important than a lower ranked attribute. However,
there is typically no real sense of magnitude in the importance value,
meaning for example, one attribute being twice as important as
another does not hold. JDM specifies no precise interpretation of
attribute importance values other than attributes with a greater
numeric value are relatively more important than those with lesser
values.
From this ranking, users can select the attributes to be used in
building models. For example, a percentage of the top attributes may
be used to construct a new dataset, or perhaps visual inspection will
Attribute
Importance
Value
Predictor
Rank
household size
1
0.19
marital status
2
0.18
promotion
3
0.16
…
…
…
workclass
17
0.008
0.2
0.18
0.16
0.14
0.12
0.1
0.08
0.06
0.04
0.02
0
Figure 4-3
Attribute importance result.

Search WWH ::

Custom Search