Environmental Engineering Reference
In-Depth Information
°
N
42
N
40
°
38
°
N
10
N
36
°
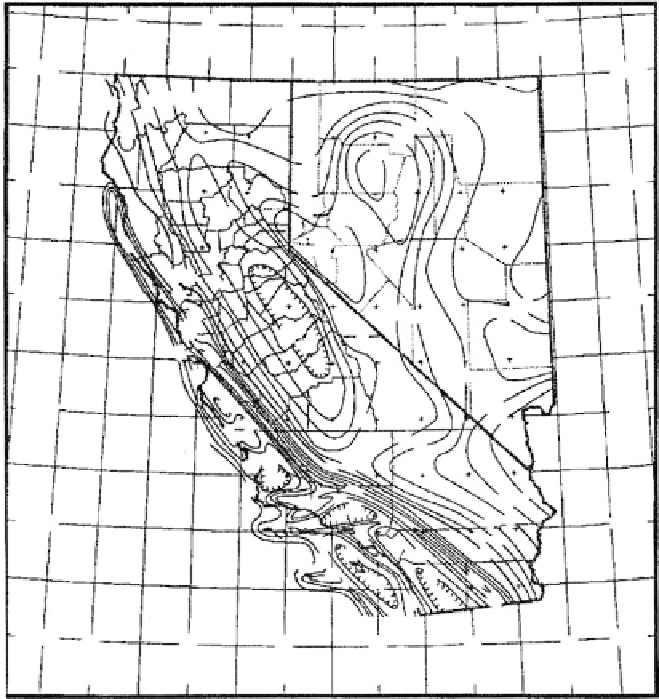
FIGURE 11.44
1991 USGS map of the 5% damped, 1.0 sec pseudo-acceleration spectral response, expressed in percent of the
acceleration of gravity, with a 10% probability of exceedence in 50 years. (From USACE, U.S. Army Corps of
Engineers, ER 1110-2-1806, July 31, 1995. With permission.)
the maximum acceleration and thus the maximum inertia force may be determined directly
from the acceleration response spectrum if the fundamental period of the structure is known.
They are also useful for comparing the response of structures in a given earthquake
where soil conditions vary, or for comparing a number of earthquakes in the same area, as
a function of soil conditions and natural periods.
References
With the availability of strong motion data, the methodology used to develop response
spectra has changed significantly in complexity since the first edition of this topic in 1984.
The reader who wants more detail is referred to Scawthorn (2003) and USACE (1995,
1999). Response spectra have been developed by numerous investigators who are listed in
Table 3-2
of EM 1110-2-6050 (USAEC, 1999). The table is a plot of seven investigator refer-
ences vs. site condition (soil and rock) for western U.S. shallow earthquakes, eastern U.S.
earthquakes, and subduction zones (plate edge) earthquakes.
Procedures to prepare response spectra are covered in Section 1615 of the IBC (2000). Two
procedures are given: (1) obtaining ground motion data from maps such as Figure 11.44,
or (2) a site-specific study.