Environmental Engineering Reference
In-Depth Information
72
74
73
75
76
77
90
79
78
89
40
88
North Virginia
Maryland
seismic zone
80
87
81
86
40
39
39
38
W.Va.
38
Ky.
Central Virginia
seismic zone
37
37
South Appalachian
seismic zone
34
1
36
N.C.
35
Legend
35
Felt reports
II-III
IV-V
VI-VII
VIII-IX
34
34
8.c.
402
33
33
Miss.
2
earthquakes in
A.o.
x
Charleston area
Two or more
earthquakes
32
32
x
South Carolina
Georgia
seismic zone
31
31
0
50
100
Scale
miles
0
50 100
km
30
30
90
72
73
89
74
88
87
75
86
74
85
84
83
82
81
80
78
79
77
FIGURE 11.10
Seismicity (1754-1971) and earthquake zone map for the southeastern United States. (From Bollinger, G.A.,
Am. J. Sci.,
273A, 396-408, 1973. With permission.) Epicenters shown by open and solid circles; zones shown by
stippling.
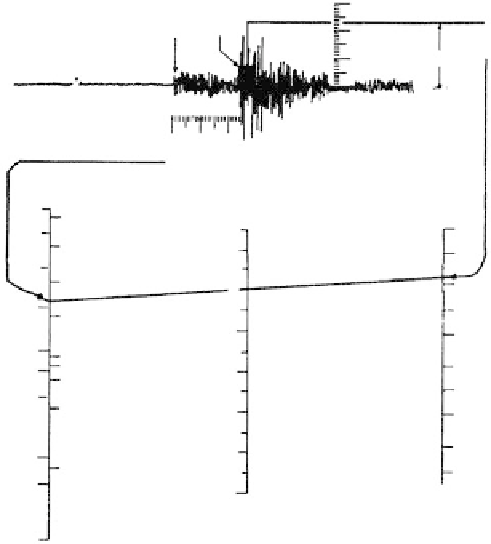
p
s
Amplitude = 23 mm
0 0 0
S-P = 24 S
100
50
6
20
10
5
5
4
2
1
0.5
3
2
0.2
0.1
Amplitude
(mm)
1
0
Distance
(km)
Magnitude
S-P Time(s)
FIGURE 11.11
A nomogram illustrating the relationship between the amplitude in a Wood-Anderson seismograph and the
Richter magnitude. The equation behind the nomogram was developed by Richter from Southern California
earthquakes. (After Richter, C.F.,
Elementary Seismology,
W.H. Freeman & Co., San Francisco, 1958. Reprinted
with permission of W.H. Freeman.)