Environmental Engineering Reference
In-Depth Information
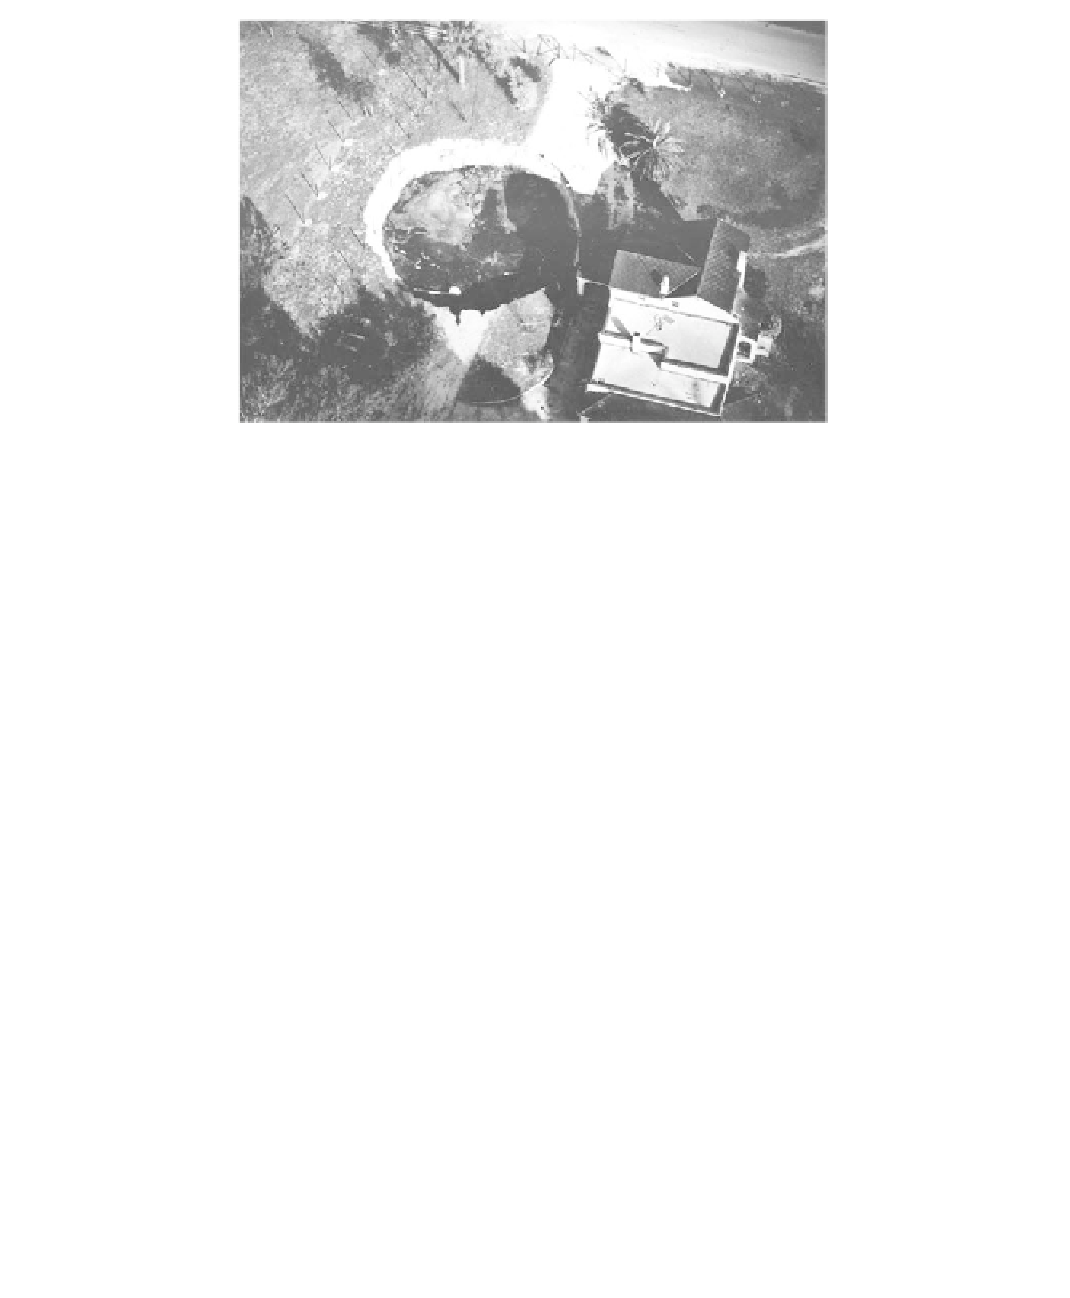
FIGURE 10.19
Sink 65 ft in diameter and 42 ft deep formed suddenly in December 1973 in Pierson, Florida, after 3 days of
continuous pumping from nearby irrigation wells. The limestone is about 100 ft in depth. (Photo: Courtesy of
George F. Sowers.)
pairs of air photos disclosed several sink holes and depressions in one area of the site as
illustrated in
Figure 10.20
(Hunt, 1973). During reconnaissance of the site in 1972, the dis-
covery of a sink 20 ft wide and 6 ft deep (
Figure 10.21)
that did not appear on the aerial
photos, dated 1969, indicated recent collapse activity. Since the Edwards overlies the major
aquifer in the area and groundwater withdrawals have increased along with area devel-
opment, it may be that the incidence of collapse activity is increasing.
10.4.3
Investigation
Preliminary Phases
Data Collection
The existing geologic data are gathered to provide information on regional rock types and
their solubility, bedding orientation and jointing, overburden types and thickness, and
local aquifers and groundwater withdrawal.
Landform Analysis
Topographic maps and remote-sensing imagery are interpreted by landform analysis
techniques. Some indicators of cavernous rock are:
Surface drainage
: Lack of second- and third-order streams; intermittent streams
and deranged drainage; and streams ending suddenly (
Figure 6.25).
●
Landform
: Sinks and depressions or numerous dome-shaped, steep-sided hills
with sinks in between
(Figure 6.26).
●
Photo tone
: Soils in slight depressions formed over cavity development will have
slightly higher moisture contents than those in adjacent areas and will show as
slightly darker tones on black-and-white aerial photos such as
Figure 10.20.
Infrared is also useful in detecting karstic features because of differences in soil
moisture.
●