Environmental Engineering Reference
In-Depth Information
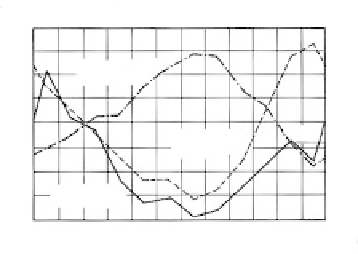
lanches, slides, and flows. A relationship among the number of rock falls, mean monthly
temperature, and mean monthly precipitation is given in
Figure 9.96
.
It is seen that the
highest incidence for rock falls is from November through March in the Fraser Canyon of
British Columbia.
9.3.5
Hazard Maps and Risk Assessment
Purpose
Degrees of slope-failure hazards along a proposed or existing roadway or other develop-
ment can be illustrated on slope hazard maps. Such maps provide the basis not only for
establishing the form of treatment required, but also for establishing the degree of urgency
for such treatment in the case of existing works, or the programming of treatment for
future works. They represent the product of a regional assessment.
Hazard Rating Systems
In recent years, various organizations have developed hazard rating systems. In the
United States, the system apparently most commonly used is the “Rockfall Hazard Rating
System” (RHRS) developed for the Federal Highway Administration by the Oregon State
Highway Department (Pierson et al., 1990). Highway departments use the RHRS to inven-
tory and classify rock slopes according to their potential hazard to motorists, and to iden-
tify those slopes that present the greatest degree of hazard and formulate cost estimates
for treatments (McKown, 1999).
Some states, such as West Virginia (Lessing et al., 1994), have prepared landslide hazard
maps. The Japanese have studied the relationships between earthquake magnitude and
epicenter distance to slope failures in Japan and several other countries and have pro-
posed procedures for zoning the hazard (Orense, 2003).
Example
The Problem
A 7 -km stretch of existing mountain roadway with a 20-year history of slope failures,
including rotational slides, debris slides, avalanches, and rock falls, was mapped in detail
with respect to slope stability to provide the basis for the selection of treatments and the
establishment of treatment priorities. A panoramic photo of the slopes in the higher ele-
vations along the roadway is given in
Figure 9.97.
80
70
60
50
40
30
20
10
0
80
70
60
50
40
30
20
10
0
Mean monthly
temperature
FIGURE 9.96
Number of rockfalls, mean monthly temperature, and
mean monthly precipitation in the Fraser Canyon of
British Columbia for 1933-1970. (Peckover, 1975; from
Piteau, D.R.,
Reviews in Engineering Geology,
Vol. III,
Coates, D.R., Ed., Geologic Society of America,
Boulder, Colorado, 1977, pp. 85-112. With
permission.)
32
°
F
Mean monthly
precipitation
Total number
of rock falls
Jan. F
M A M J
Month (1933 to 1970)
J
A
S
O
NDec.