Environmental Engineering Reference
In-Depth Information
Q
L
1
k
1
L
2
k
2
L
1
+++
L
2
L
3
L
4
k
v
(avg)
=
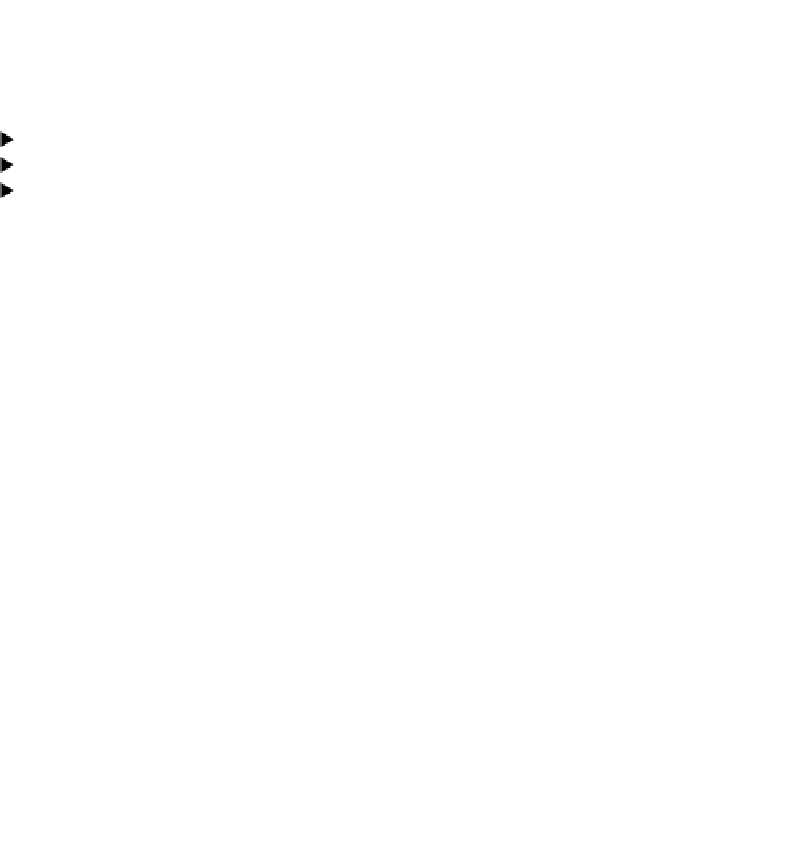
FIGURE 8.24
An evaluation of the effect of stratification
on permeability, where
Q
is the quantity of
flow,
L
the flow path length, and
k
the
coefficient of permeability. (From Salzman,
G.S., J.S. Ward & Associates, Coldwell,
New Jersey, 1974.)
Note
: The electrical analogy:
If
L
1
L
1
L
2
L
3
L
4
L
3
k
3
+++
k
1
k
2
k
3
k
4
L
4
k
4
Case 1
L
1
k
1
L
2
k
2
k
1
L
1
+
k
2
L
2
+
k
3
L
3
+
k
4
L
4
Q
k
h
(avg)
=
L
3
k
3
L
1
+++
L
2
L
3
L
4
L
2
L
3
L
4
1, and
k
1
1,
k
2
2,
L
4
k
4
k
3
3,
k
4
4, then in case 1,
k
v(avg)
1.9 and in
Case 2
case 2,
k
h(avg)
2.5.
h
= 0
= 0
z
= 1 ft
= 62.4 psf
γ
t
=
127 pcf
Area A
L
= 2 ft
= 187.2 psf
FIGURE 8.25
Porewater pressures for the no-flow condition and
buoyancy water pressures.
No-Flow and No-Applied-Stress Condition
For the condition of no flow and no applied stress, pore-water pressures are equal to the
unit weight of water times the depth below the free-water surface as shown in Figure 8.25,
expressed as
u
γ
w
z
w
(8.4)
Buoyancy pressures refer to the vertical pressures acting on each end of the soil column;
on the specimen bottom the buoyancy force equals 187.2 psf.
Upward Flow Condition
In
Figure 8.26,
a head of 2 ft. (seepage force) causes an increase in pore pressure, at the base
of the soil column supported on a screen, to
u
312 psf. The tail water is barely overflow-
ing and the 2 ft. head has been dissipated in viscous friction loss in the soil specimen.