Environmental Engineering Reference
In-Depth Information
7
Soil-moisture utilization,4.0 in.
6
5
Runoff
12.2 in.
4
Soil-moisture
accretion,
4.0 in.
Precipitation
Precipitation
Moisture
deficiency
1.0 in.
3
2
1
0
Oct.
Nov. Dec.
Jan.
Feb.
Mar.
Apr.
May.
June.
July.
Aug.
Sept.
(a)
0
Zone of saturation
Oct.
Nov.
Dec. Jan.
Feb.
Mar.
Apr.
May.
June.
July.
Aug.
Sept.
(b)
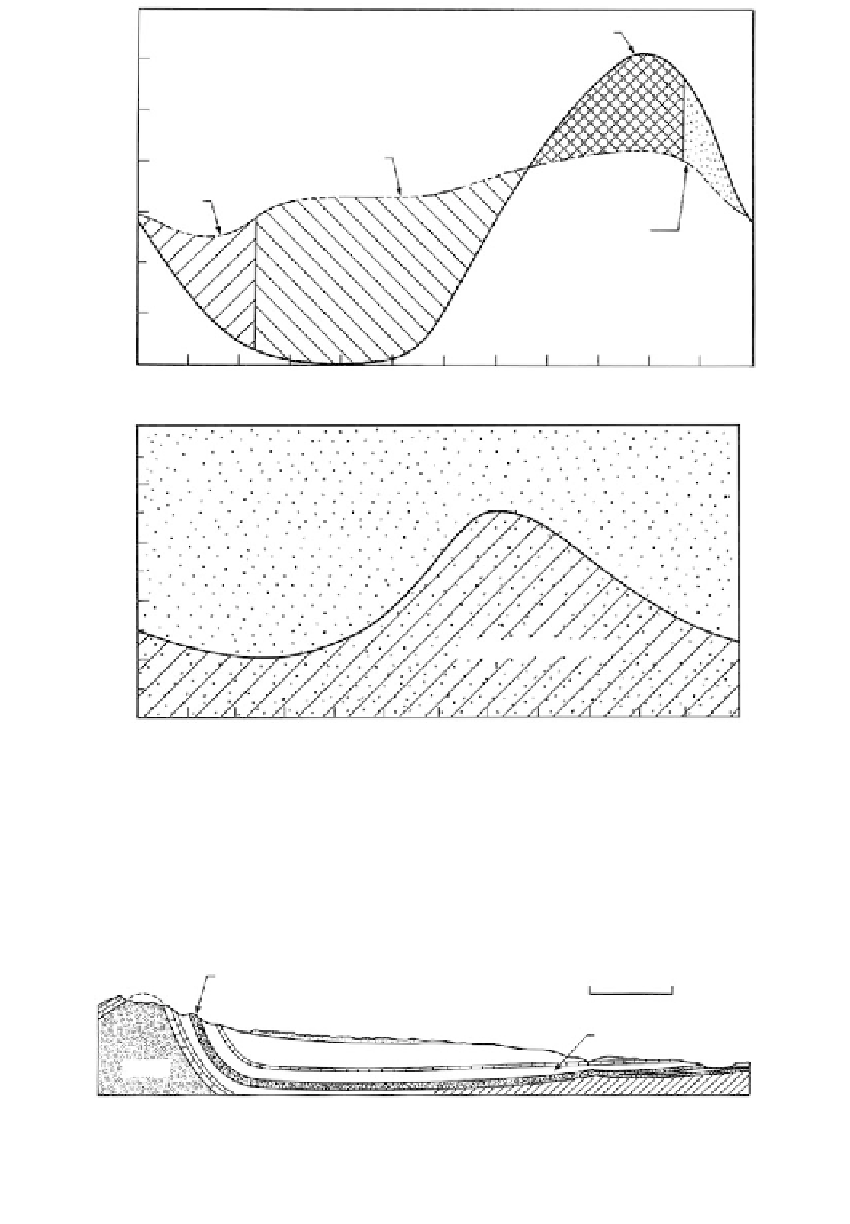
FIGURE 8.19
Relationships between seasonal precipitation and the groundwater table in a cool, moist climate: (a) March of
normal precipitation and potential evapotranspiration at College Park. Maryland and (b) the variation of
water-table depth that normally may be anticipated in a cool, moist climate. Even where annual rainfall
exceeds evaporation, the infiltration of runoff and groundwater recharge is cyclic. (Part (a) from Linsley, R.K. et
al.,
Hydrology for Engineers
, 1958. Reprinted with permission of McGraw-Hill Book Company.)
Black
Hills
Dakota
sandstone
0
50 miles
Shale
Shale
Schists
FIGURE 8.20
Section through the Dakota artesian aquifer, from the intake area in the Black Hills of western South Dakota to
northern Iowa. Vertical scale is tremendously exaggerated.
Saltwater intrusion
results from the overpumping of freshwater wells. The salt water
migrates inland along the coastline, resulting in the pollution of freshwater wells with salt
water as shown in
Figure 8.21b.