Environmental Engineering Reference
In-Depth Information
Stress (kg/cm
2
)
Water content (%)
0
20
40
60
80
0
0.4
0.8
1.2
1.6
2.0
2.4
2.8
3.2
0
(lb/ft
3
)
% Clay
S.C.
(gr/ft.)
s
t
10
100.7
77
0.2
12
129
−
1
98.2
82
0.4
21
96.1
86
−
2
−
3
−
4
−
5
−
6
−
7
−
8
−
BV-1
20
BV-2
96.2
78
48
96.7
80
0.6
37
95.6
82
0.8
54
BV-4
30
95.5
150
94.9
80
0.5
127
9
94.4
85
0.9
100
40
96.1
83
88
0.8
128
−
10
−
11
−
12
−
13
−
14
−
15
−
16
−
17
−
95.6
74
95.3
95.8
85
1.2
72
50
96.2
86
95.7
1.5
76
118
60
97.0
80
1.9
53
96.9
53
18
−
19
−
20
−
21
−
22
−
23
70
97.1
2.2
76
98.1
83
2.0
37
Effective
overburden
stress
80
w
p
w
1
98.5
98.8
73
3.4
34
w
n
Max
Min
Prob
90
98.9
2.5
BV-5
Preconsolidation
stress
100
Field vane results
110
FIGURE 7.103
Characteristics of Canadian glaciomarine clay. (From Lambe, T. W. and Whitman, R. V.
Soil Mechanics
, Wiley,
New York, 1969. As provided by the Division of Building Research, National Research Council of Canada.
Reprinted with permission of John Wiley & Sons, Inc.)
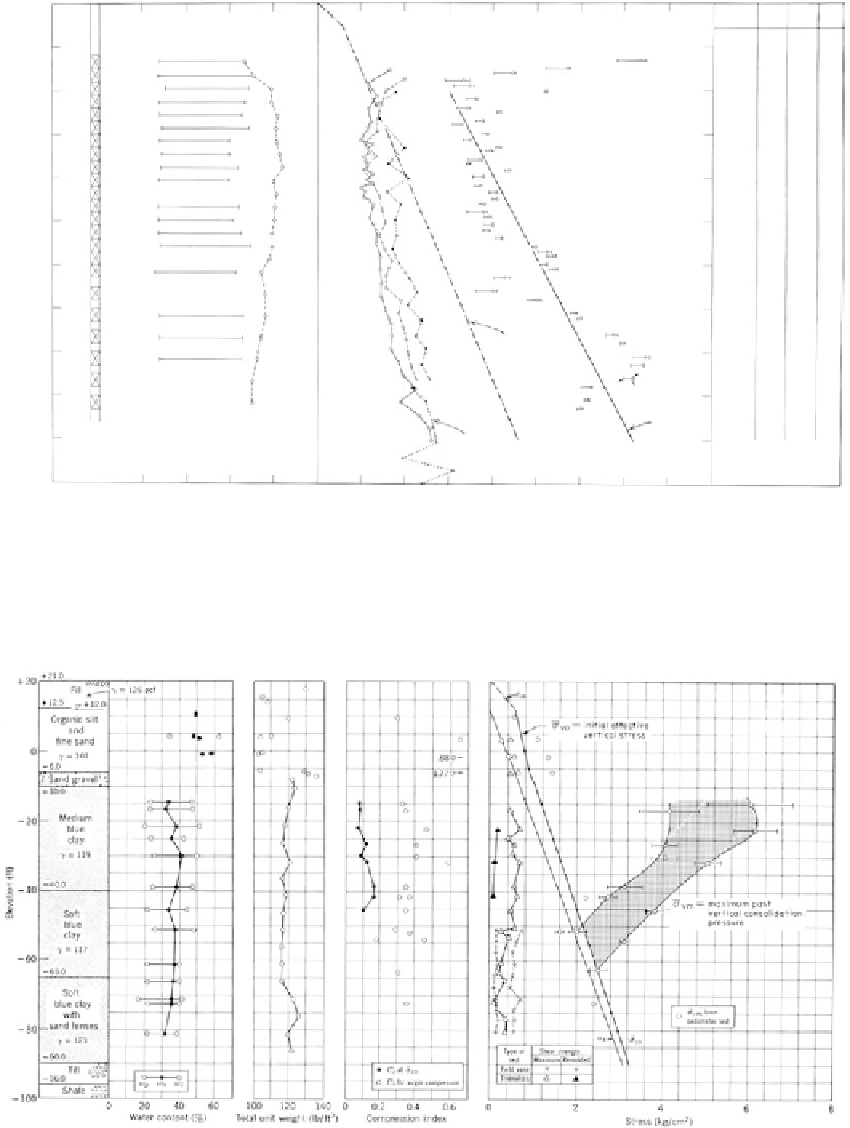
+21.0
+20
γ
= 125 pcf
Fill
+12.5
+12.0
Organic slit
and
fine sand
γ
= 101
Sand gravel
σ
vm
= Initial effective
vertical stress
0
.88
1.77
- 6.0
- 10.0
Medium
blue
clay
-20
γ
= 119
- 40.0
-40
σ
vm
= Maximum past
Soft
blue
clay
vertical consolidation
pressure
γ
= 117
-60
- 65.0
Soft
blue clay
with
sand lenses
-80
γ
= 123
- 90.0
- 96.0
Till
Shale
-100
0
20
40
60
100
120
140
0
0.2
0.4
0.6
0
2
4
6
8
Total unit weight (lb/ft
3
)
Water content (%)
Compression index
Stress (kg/cm
2
)
FIGURE 7.104
Section and laboratory test results of glaciomarine clays from Boston, Massachusetts. (From Lambe, T. W.
and Whitman, R. V.
Soil Mechanics
, Wiley, New York, 1969. Reprinted with permission of John Wiley & Sons,
Inc.)