Environmental Engineering Reference
In-Depth Information
Plasticity chart
50
26
16
High
Project index
15-Washinton HSES.
26-FT. Green ”
Plasticity
18
21
40
CH
8
5
10
7-Wagner ”
23
14
19-Lillian wald ”
17-N.Y.U.-Bellevue
23-Laguardia houses
7
17
30
18
CL
28
Medium
Plasticity
14-Carver ”
8-Foster ”
5-ST. Nicholas ”
20
20-Baruch ”
10-Sen. TAFT ”
11-Jefferson ”
MH
or
OH
6-Gen. grant ”
Silt
clayey silt
varves
25-U.S. Navy YD.
12-B. Franklin ”
16-Metropolit. HOSP.
28-Red hook HSES.
10
CL
ML
ML
or
OL
0
0
10
20
30
40
Liquid limit
50
60
70
80
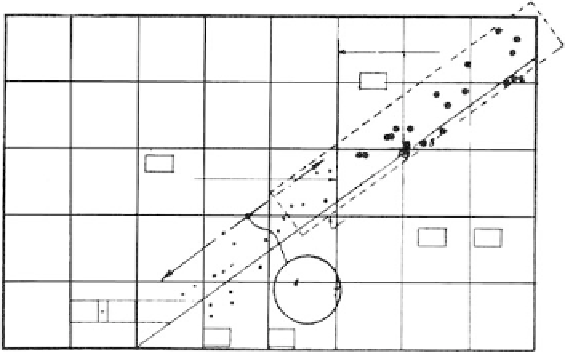
FIGURE 7.99
Plasticity chart for silt and clay varves; varved clays from New York City. (From Parsons, J. D.,
Proc. ASCE J.
Geotech. Eng. Div
., 102, 605-638, 1976. With permission.)
2.0
Legend:
Test
Symbol
Location
Symbol
2
Albany, NY
1,4
10
Unconfined
Triaxial UU
Triaxial compression CU
Triaxial extension CIU
Lab vane
Direct shear
1.8
2
Syracuse, NY
Amherst, NY
3
Beacon, NY
5
1.6
Bowline point, NY
6
2
Ossining, NY
7
1.4
Hackensock, NJ
8
9
Rutherford, NJ
9
6
Parsippany, NJ
10,11
2
1.2
Hartford, conn.
1.0
Field failure-Kingston, N.Y.
7
10
10
6
3
1
1
2
0.8
2
1
10
1
8
Limits of band proposed
by ladd for connecticut
river valley varved clays
3
5
10
9
10
2
4
0.6
9
3
10
10
6
4
2
2
7
3
3
Field failure-Beacon, N.Y.
5
2
5
11
7
0.4
2
5
9,2
8,3
4
7
1
11
11
9
10
10
9
10
7
3
8
7
9
11
5
4
4
10
1
2
2
10
7
2
7
6
3
0.2
3
5
2
3
8
5
4
2
4
11
4
6
5
1
2
7
1
5
5
1
3
3
3
0.0
1
2
3 4 5
Overconsolidation ratio (OCR)
6
7
8
9 10
20
30
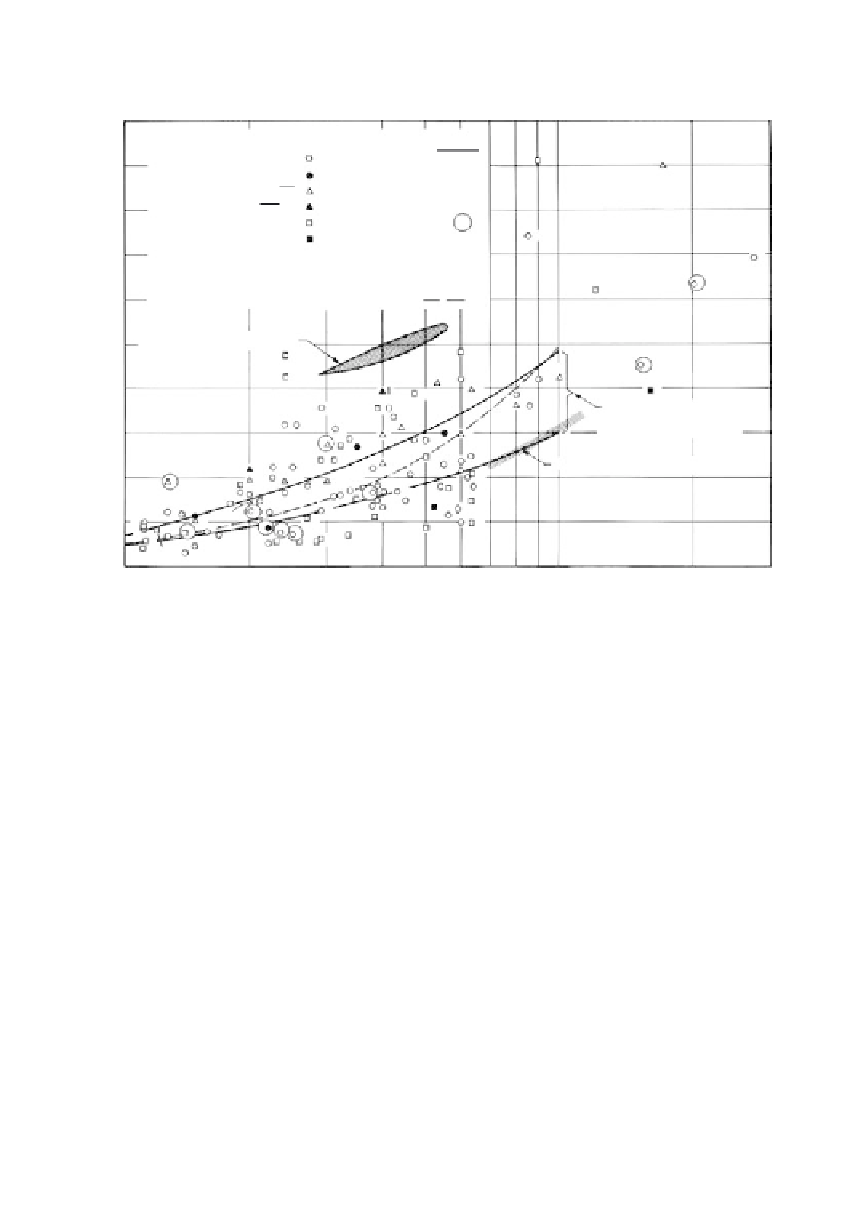
FIGURE 7.100
Overconsolidation ratio vs. strength characteristics of varved clays from New York, New Jersey and
Connecticut. (From Murphy, D. J.,
Proc. ASCE J. Geotech. Eng. Div
., 101, 279-295, 1975. With permission.)
Depositional Characteristics
Deposition
Clays of colloidal dimensions tend to remain in suspension for long periods in freshwater,
but when mixed with salty water from the sea the clay curdles into lumps and flocculates.


