Environmental Engineering Reference
In-Depth Information
TABLE 2.6
Interpretation of Color Infrared Photos (CIR)
Color
Interpretation
Red
Healthy vegetation
Bright
Pasture, winter wheat
Darker
Evergreens: pine, conifers
Dark
Cypress
Pink
Damaged or stressed vegetation
Light
Dead or unhealthy vegetation
Light blue green
Dead or unhealthy vegetation
Bluish-gray
Dormant vegetation
Dark green-black
Wetlands
Greenish white
Fallow fields
White
Bare fields, dry soil
Sandy beaches, gravel roads, snow
Gray
Bare fields, wet soil; urban areas
Blue
Water bodies; lakes, rivers; land fills
Light
Heavy sediment load
Blue
Moderate sediment load
Dark
Very little sediment load
Black
Clear water; or sediment
1
7
2
3
5
4
6
5
6
7
7
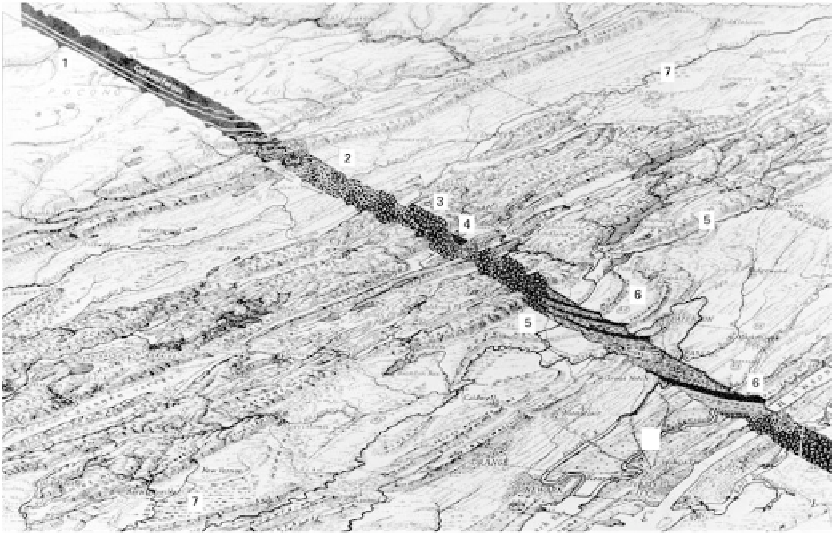
FIGURE 2.10
Physiographic diagram of northern New Jersey illustrating relationships between rock type, structure, and
landform. 1, horizontally bedded sedimentary rocks; 2, folded sedimentary rocks; 3, batholith of recambrian
gneiss; 4, graben formed by fault blocks; 5, scrap of the Ramapo fault (see
Figure 6.61);
6, basalt dikes and
diabase sill; 7, glacial lake beds. See also Geology Map
(Figure 2.2)
,
satellite image (
Figure 2.5)
,
and SLAR
image (
Figure 2.6)
.
(Figure drawn by E.J. Raisz, courtesy of Geographical Press, a division of Hammond
World Atlas Corp. 12643.)