Environmental Engineering Reference
In-Depth Information
46
44
42
40
38
Peak
'
36
34
32
30
28
0 0 0 0 0 0
Relative density (%)
60
70
80
90
100
Strain
(a)
(b)
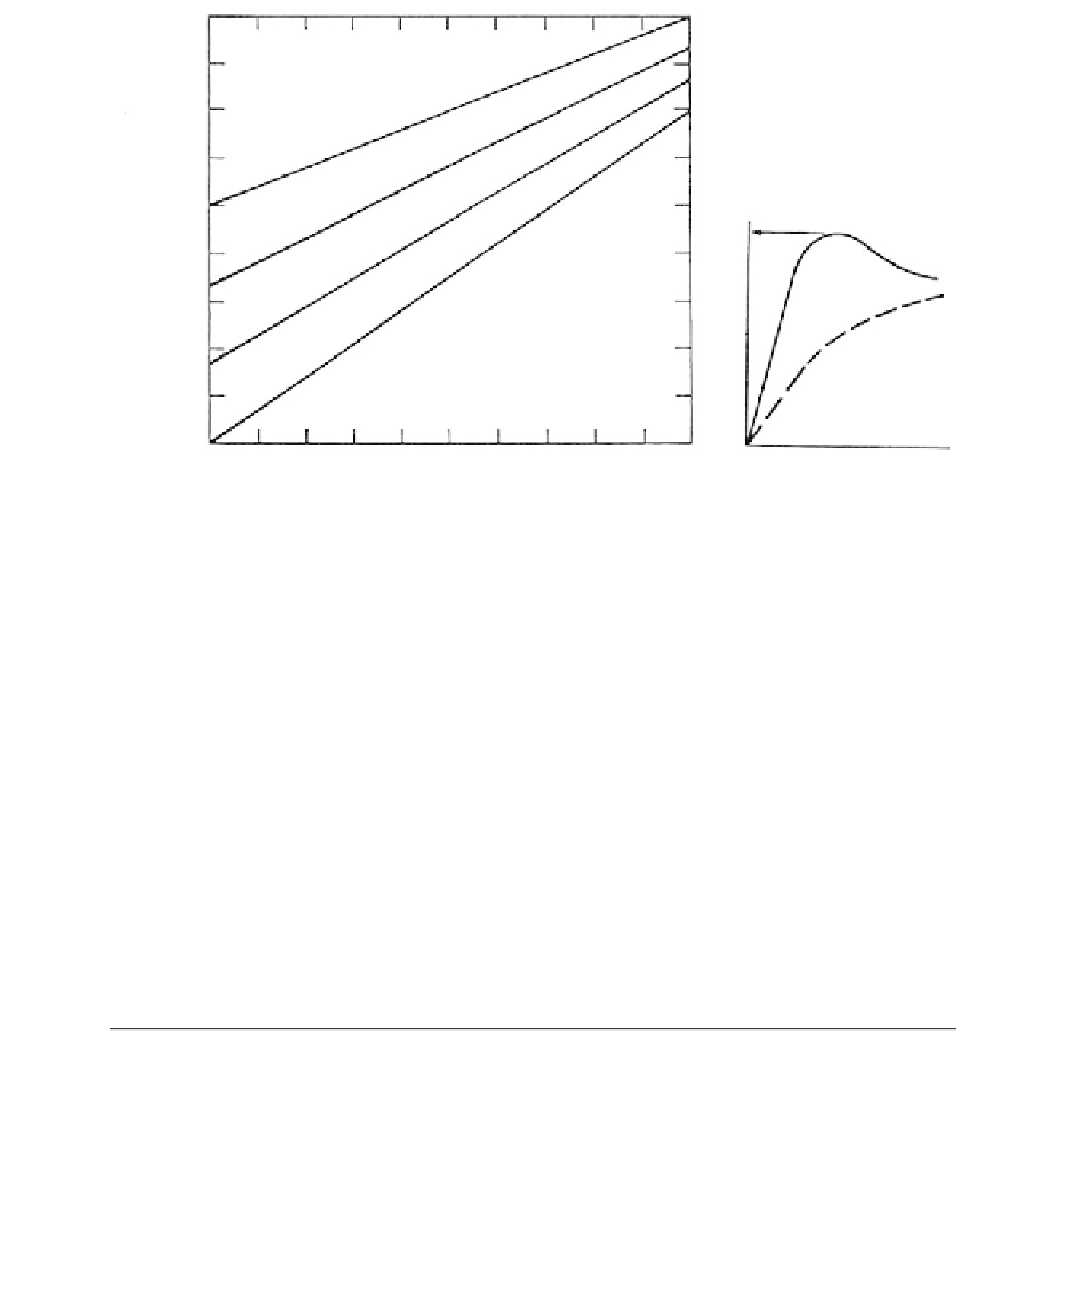
FIGURE 3.93
Friction angle and relative density relationships for granular soils: (a) chart for the approximate evaluation
of the peak angle of internal friction from relative density — Schmertmann modification of Burmister (1948);
(b) in problems where the sand may strain past the peak strength value before a general failure occurs, then
a reduced value of
must be used, particularly in the denser cohesionless soils. (
Note
: (1) For quartx sands.
(2) Angular grains can increase
φ
by about 15% in the loose state and 30% in the dense state over rounded
grains.) (Reprinted with permission of the Federal Highway Administration.)
φ
TABLE 3.37
Common Properties of Clay Soils
Strength
b
Consistency
N
Hand Test
γ
sat
(pcf)
a
U
c
(tsf)
Hard
30
Difficult to indent
125
4.0
Very stiff
15-30
Indented by thumbnail
130-140
2.0-4.0
Stiff
8-15
Indented by thumb
120-130
1.0-2.0
Medium (firm)
4-8
Molded by strong pressure
110-120
0.5-1.0
Soft
2-4
Molded by slight pressure
100-110
0.25-0.5
Very soft
2
Extrudes between fingers
90-100
0-0.25
e
a
γ
sat
γ
dry
γ
w
.
1
e
b
Unconfined compressive strength
U
c
is usually taken as equal to twice the cohesion
c
or the undrained shear
strength
s
u
. For the drained strength condition, most clays also have the additional strength parameter
φ
,
although for most normally consolidated clays
c
0 (Lambe and Whitman, 1969). Typical values for
s
u
and
drained strength parameters are given in
Table 3.38.
Typical properties of cohesive materials classified by geologic origin, including
density, natural moisture contents, plasticity indices, and strength parameters, are given
in Table 3.38.