Environmental Engineering Reference
In-Depth Information
Overconsolidation ratio
(OCR) is defined as the ratio of the maximum past pressure
p
c
to
the existing effective overburden pressure
p
o
. In general, for NC clay,
p
c
/
p
o
0.8 to 1.5 and,
o
> 1.5 (Clemence and Finbarr, 1980). OCR is used to estimate consolida-
tion in clays (Schmertmann, 1977) for correlation of strength properties (Terzaghi and
Peck, 1967) and for estimating
K
o
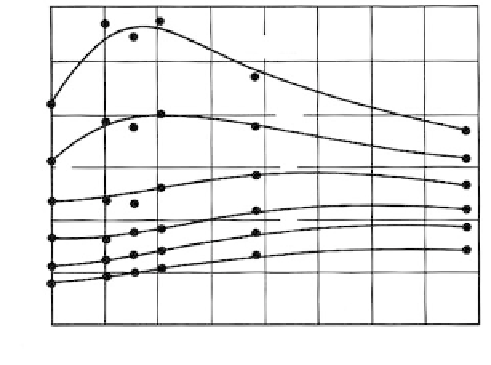
in terms of PI (Brooker and Ireland, 1965).
K
o
as a func-
tion of OCR and PI is given in
Figure 3.80.
The undrained shear strength
s
u
of NC clay normally falls within a limited fraction of
the effective overburden stress, usually ranging from
s
u
/
p
for OC clay,
p
c
/
p
0.16 to 0.4 (
Section 3.4.2)
.
It
can be estimated as an average value of
(
s
u
/
p
)NC
0.33
(3.65)
or in terms of PI (Terzaghi and Peck, 1967) as
s
u
/
p
0.11
0.0037PI
(3.66)
Typical
e
-log
p
curves for various soil types are given in
Figure 3.81.
They serve to illus-
trate that soils of various geologic origins (see
Chapter 7)
have characteristic properties.
Compression vs. Time Relationships
Significance:
The
e
-
p
curve provides an estimate of the compression occurring at 100% con-
solidation. In practice, it is important to estimate the amount of settlement that will occur
under a given stress increment in some interval of time (end of construction, 15 years). The
time rate of consolidation is analyzed from the compression vs. log time curve for a par-
ticular load increment (
Figure 3.82)
.
Curve characteristics:
The curve is divided into two portions for analysis: primary con-
solidation occurs while the excess pore pressures dissipate and consolidation proceeds in
accordance with theory; secondary consolidation is a slow, continuing process of com-
pression beyond primary consolidation after the excess pore pressures have been dissi-
pated. The phenomenon is not clearly understood.
Primary consolidation:
The time
t
to reach a given percent consolidation
U
is expressed as
t
(
T
v
/
c
v
)
H
2
(3.67)
where
T
v
is the theoretical time factor.
3.0
OCR = 32
2.5
F
16
2.0
8
E
D
1.5
4
2
1
1.0
C
B
FIGURE 3.80
Relationship between
K
0
, OCR, and PI.
(From Brooker, E. W. and Ireland, H. O.,
Can. Geotech. J.
II, 1965. Reprinted with
permission of the National Research
Council of Canada.)
0.5
A
0
0
10
20
30 40
Plasticity index, PI
50
60
70
80