Environmental Engineering Reference
In-Depth Information
Procedures (ASTM D2435-02, D4186-98)
A specimen from an undisturbed clay sample is trimmed carefully into a rigid ring (brass
for most soils; Teflon for organic soils because of corrosion), and porous stones are placed
on top and bottom to permit vertical drainage. (A variation to permit horizontal drainage
uses a ring of porous stone and solid-end platens.)
The assembly is placed in a loading frame and subjected to a sequence of loads starting
initially with very small loads. Then (normally) the load is increased by doubling until the
test load significantly exceeds the anticipated field load, and the “virgin” compression
curve and preconsolidation stress (
p
c
) have been defined (Figure 3.78). Usually, three loads
beyond the range of
p
c
are required to define the virgin compression.
After the initial seating loading, the specimen is immersed in water to maintain satura-
tion (unless the clay is expansive, as will be discussed). Each load remains until pore pres-
sures are essentially dissipated and consolidation terminated; for most clays, 24 h is
adequate for each load cycle. When first applied, the load is carried by the pore water. As
water drains from the specimen, the voids close, the soil compresses, and the strength
increases until it is sufficient to support the load and the extrusion of water ceases. At this
point “primary compression” has terminated and the next load increment is applied (see
the discussion of secondary compression below.) Measurements are made and recorded
during the test of deflection vs. time for each load increment. (Plotting the data during the
test shows the experienced technician when full consolidation under a given load has
occurred, at which point, the next load is applied. This practice eliminates the need to wait
24 h between loadings. If pore-water pressures are measured, when they reach zero the
next load increment is applied.)
Pressure vs. Void Ratio Relationships
The total compression that has occurred after the application of each load is plotted to yield
a curve of either pressure vs. strain or pressure vs. void ratio (
e
-log
p
curve), where pres-
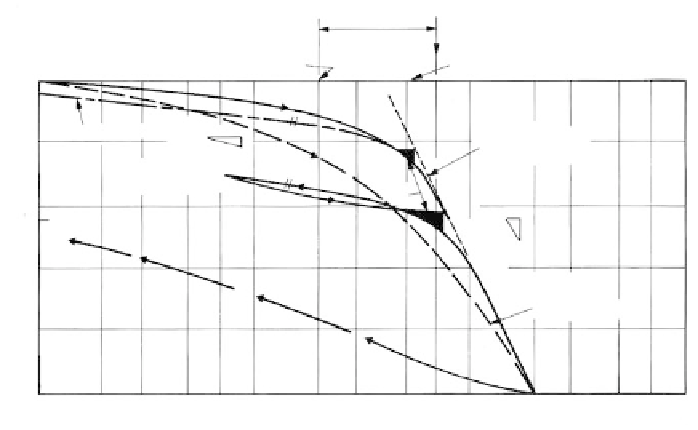
sure is plotted on a log scale, and strain or void ratio on an arithmetic scale (Figure 3.78).
p
f
∆
p
Overburden pressure p
o
Preconsolidation pressure P
c
e
a
Design curve
Undisturbed
sample curve
C
r
Unload
−
reload
cycle
"a"
e
f
C
c
Disturbed
sample curve
0.1
0.2
0.3
0.5
0.7
1.0
3
Pressure, tsf (log scale)
2
5
7
10
20
50
100
FIGURE 3.78
Consolidation test: pressure-void ratio curve (
e
-log
p
).