Environmental Engineering Reference
In-Depth Information
0 0 0
30
0
50
60
70
80
90
100
Granular alluvial desposits
f
c
Quiet water to very low velocities
C
R
−
1.0 to 2.5 S type
D
50
0.15
0.015
f
c
Low velocities
D
50
C
R
−
0.7 to 1.5
S type
0.01
0.25
f
c
Moderate velocities
S type
D
50
0.2
0.6
C
R
−
1 to 3
Dune sands
f
c
D
50
C
R
−
0.7 to 2
S type
0.07
0.4
Beach sand deposits, wave formed
Steep beach
c
f
C
R
−
0.7 to 2.5
D
50
0.8
0.3
S type
Flat beach
c
R
−
0.7 to 1.5
S type
c
f
D
50
0.3
0.1
Glacial outwash
Flat slopes
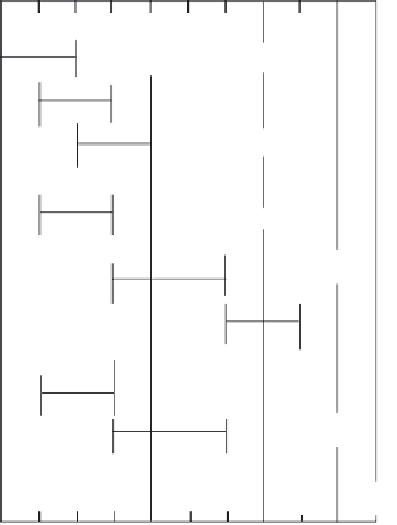
FIGURE 3.11
Probable initial depositional relative densities
produced by geologic process of granular soil
formation as a tentative guide showing dependence on
grain-size parameters, grading-density relations, and
geological processes. (From Burmister, D. M., ASTM
Special Technical Publication No. 322, 1962a, pp. 67-97.
Reprinted with permission of the American Society for
Testing and Materials.)
f
c
D
50
C
R
−
0.7 to 2
S type
0.15
0.40
f
c
Moderate slopes
D
50
C
R
−
2 to 5
0.25
2.0
Types E,D,
and CD
Loose
Medium compact
Compact
Ver y
compact
_
+
_
+
_
MC
+
C
L
VC
0 0 0
30
0
50
60
70
80
90
100
Initial-depositional relative density
D
R
(%)
Plasticity
Definitions and Relationships
Atterberg limits
, which include the liquid limit, plastic limit, and the shrinkage limit, are
used to define plasticity characteristics of clays and other cohesive materials.
Liquid limit (
LL
)
is the moisture content at which a soil passes from the liquid to the plas-
tic state as moisture is removed. At the LL, the undrained shear strength
s
u
≈
0.03 tsf.
Plastic limit (
PL
)
is the moisture content at which a soil passes from the plastic to the
semisolid state as moisture is removed.
Plasticity index (
PI
)
is defined as PI
PL.
Shrinkage limit (
SL
)
is the moisture content at which no more volume change occurs
upon drying.
Activity
is the ratio of the PI to the percent by weight finer than 2
LL
m (Skempton, 1953)
(see
Table 5.28
and
Section 10.6.2
for significance in identifying expansive clays).
Liquidity index (
LI
)
is used for correlations and is defined as
µ
LI
(
w
PL)/(LL
PL)
(
w
PL)/PI
(3.4)
Significance
A plot of PI vs. LL provides the basis for cohesive soil classification as shown on the plas-
ticity chart
(Figure 3.12).
Correlations can be made between test samples and characteris-
tic values of natural deposits. For example, predominantly silty soils plot below the A line,
and predominantly clayey soils plot above. In general, the higher the value for the PI and
LL, the greater is the tendency of a soil to shrink upon drying and swell upon wetting. The
relationship between the natural moisture content and LL and PI is an indication of
the soil's consistency, which is related to strength and compressibility (see
Table 3.37)
.
The