Environmental Engineering Reference
In-Depth Information
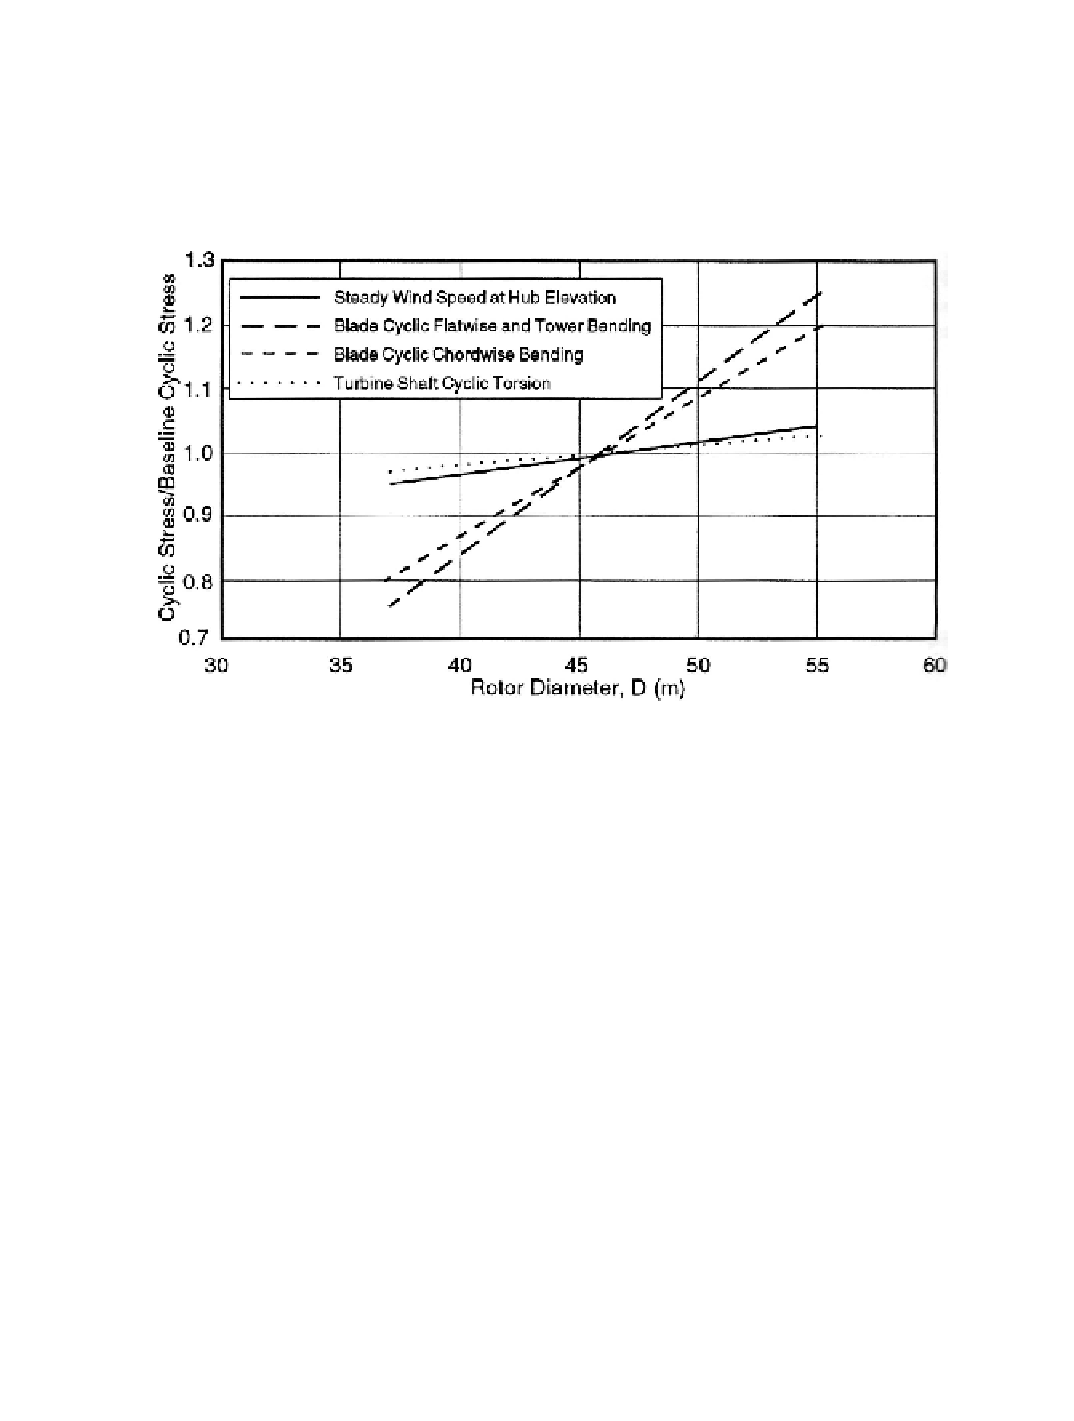
Combining the data in Figure 12-15 with Equations 12-9 produces the stress trend graph
in Figure 12-16. Here we see that blade and tower cyclic bending stresses in geometrically-
similar HAWTs increase linearly with the scale factor, to a first approximation. This is
similar to a well-known scaling property of cantilever beams loaded by their own weight. In
other words, a baseline wind turbine can be geometrically-scaled
down
without increasing
fatigue stresses in the blades and tower, but not
up
. Cyclic shear stresses in the turbine shaft,
however, remain approximately constant with scale changes.
Figure 12-16. Fatigue stress trend chart derived from the load-trend chart in Figure 12-
15.
In geometrically-similar wind turbines, blade and tower fatigue stresses vary linearly with
rotor diameter while shaft cyclic shear stresses remain relatively constant.
Search WWH ::

Custom Search