Environmental Engineering Reference
In-Depth Information
The factors in Equations (12-5) for the baseline case are then calculated to be
a
=
0.00
d
= 0.94
b
=
1.00
e
=
1.04
c
=
0.87
g
=
0.28
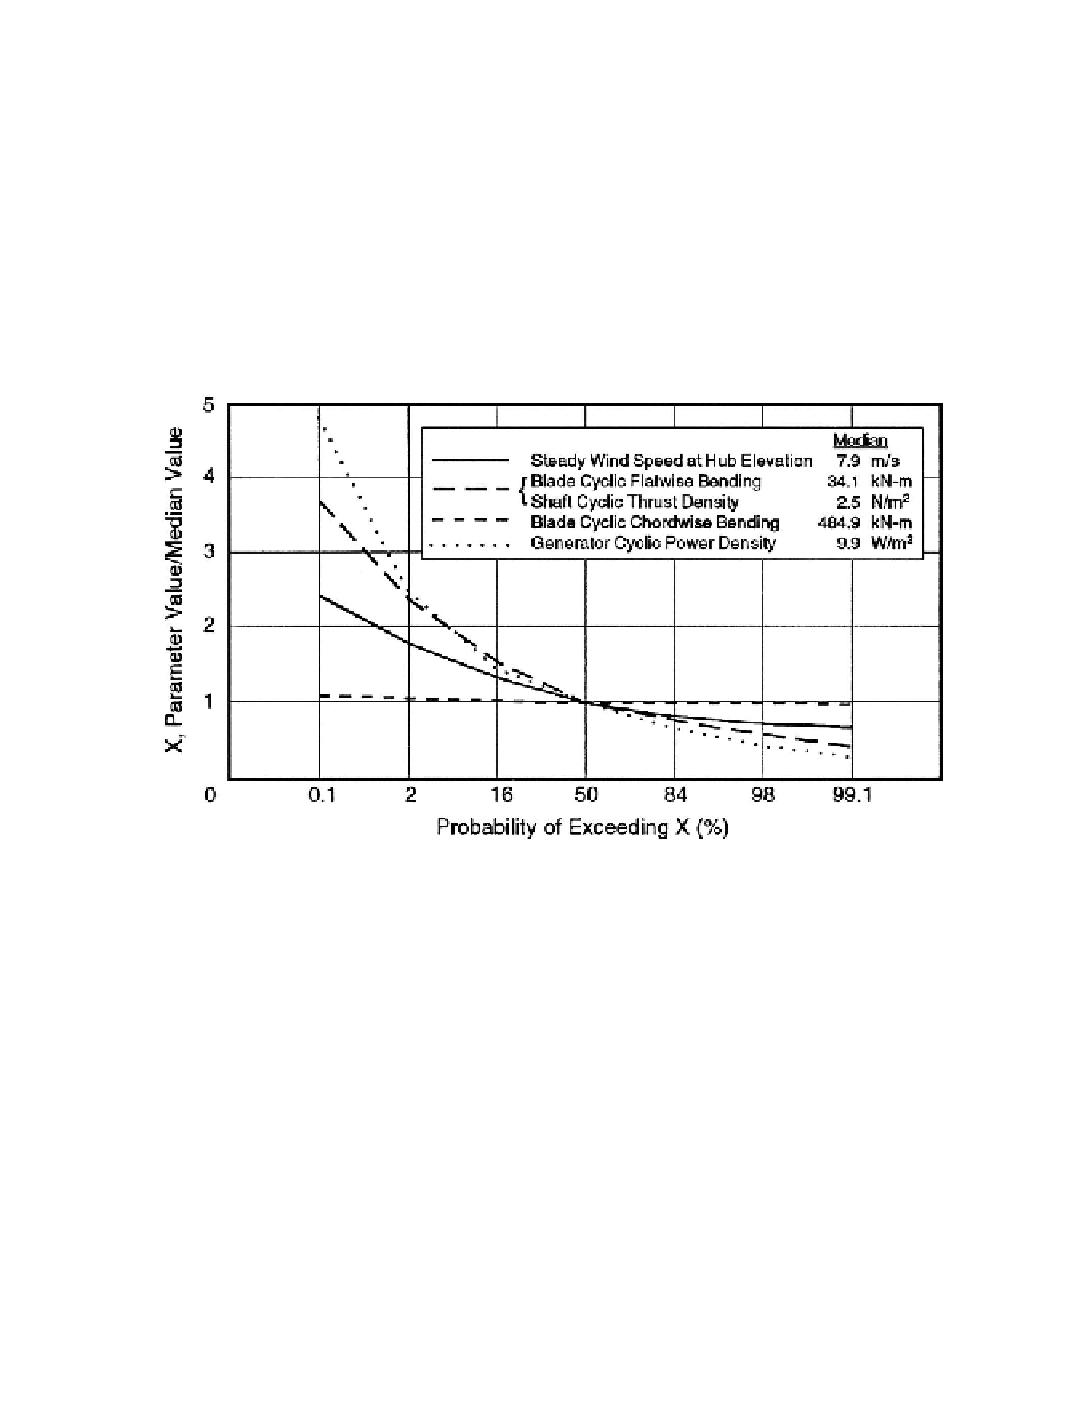
Figure 12-14 presents the probability distributions of the wind and fatigue loads as cal-
culated for the baseline case. The format here is the same as in Figures 12-11, except that the
ordinate scale is linear rather than logarithmic, which is more convenient for design purposes.
With the exception of the blade cyclic chordwise moment, we see that the low-probability,
high-percentile cyclic loads that are most damaging in fatigue can be 2.5 to 5 times the me-
dian cyclic loads on our baseline turbine. Because chordwise moments in larger HAWTs are
dominated by the force of gravity, they typically have a
narrow-band distribution
about their
mean levels.
Figure 12-14. Wind and fatigue load probability distributions calculated for the sample
baseline HAWT.
Configuration: Diameter = 46 m, rated power = 410 kW, teetered hub,
upwind shell tower.
Effect of Changing the Rotor Size
To preserve the turbine shape while varying its size, several parameters must be ex-
pressed in terms of the rotor diameter or converted to ratios, as follows:
c
t
= 0.0174
D
m
U
0
= 7.9 (
D
/46.0)
0.232
m/s
H
= 0.826
D
m
U
2
= 1.81
U
0
m/s
N
= 1,380/
D
m
P
R
= 0.194
D
2
kW
N
/w
c
= 0.20
M
g
= 456 (
D
/46.0)
3
(
c
t
/0.80) kN-m
Re-calculating loads as the diameter is changed by ± 20 percent from its baseline size of 46
m, normalizing the results by the baseline loads to obtain load ratios, and plotting the results
Search WWH ::

Custom Search