Environmental Engineering Reference
In-Depth Information
Table 12-6. Correlation Results
(All mean deviations = 0)
Cyclic Load
Standard Deviation
Coefficient of Variation
Blade flatwise bending
10.0%
10.0%
Blade chordwise bending
4.5%
4.5%
Generator power density
4.4 W/m
2
19.9%
Rotor thrust density (est.)
0.8 N/m
2
12.6%
Representative:
11.8%
[Spera 1993]
elements in the power train and tower. Second, the equations are based on a
limited test time
without a systematic sampling of diurnal and seasonal effects. Third and most important,
there is an
expected range of dynamic responses
between similar wind turbines, based on
the accuracy with which the turbine has been modeled and the extent to which the modeling
results have been translated into a design that alleviates fatigue loads.
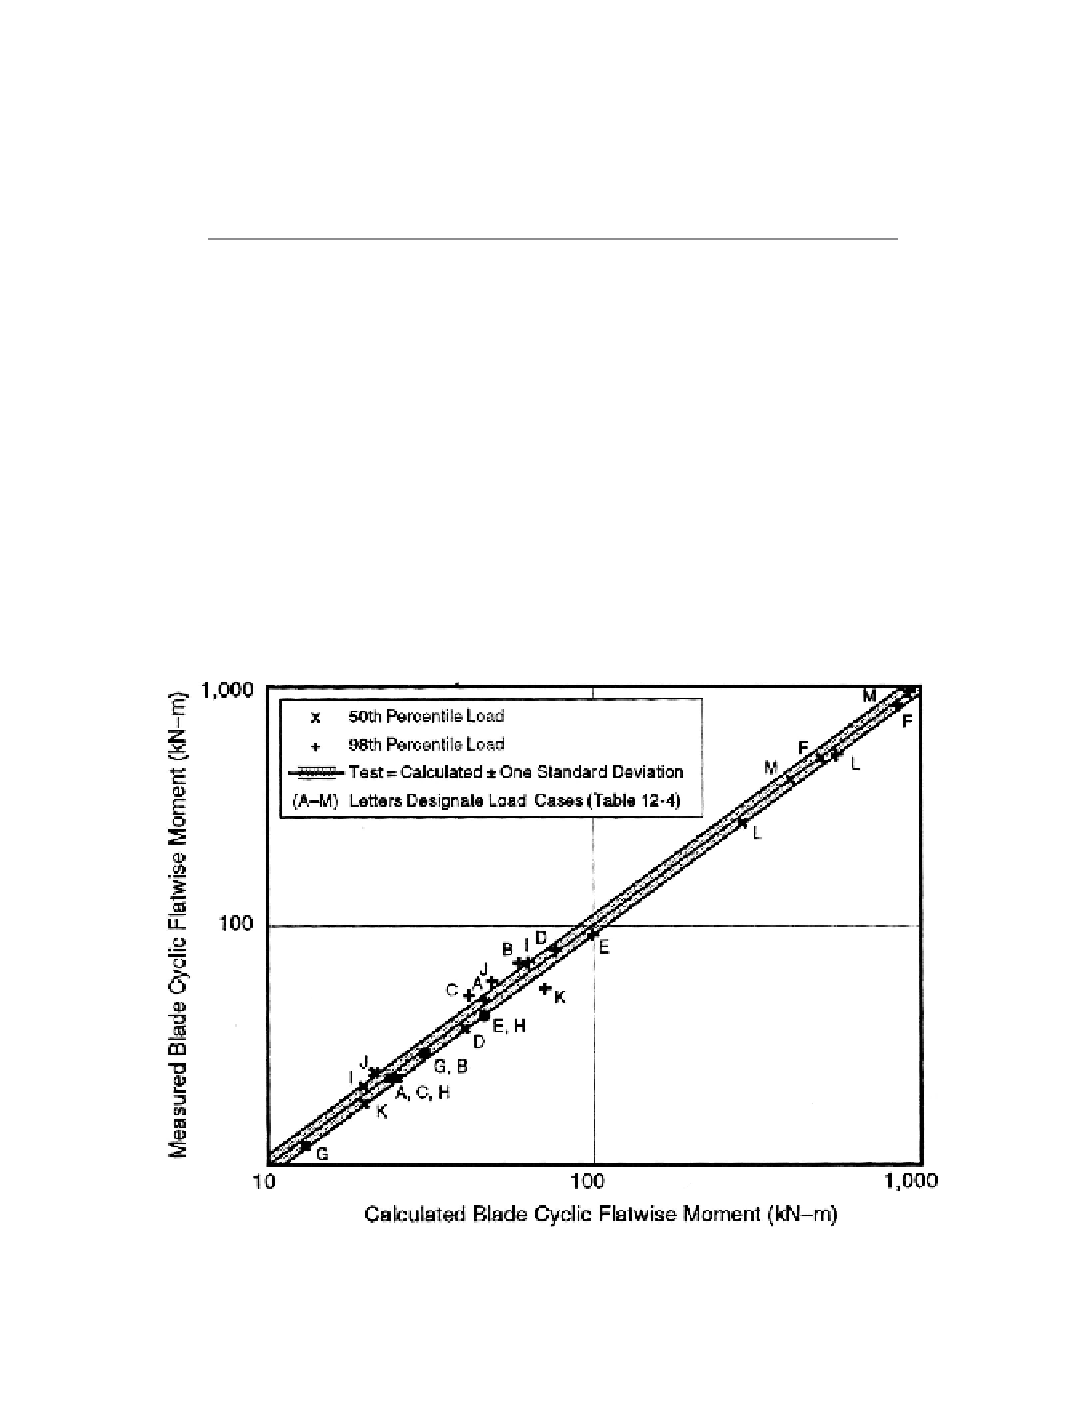
An interpretation of Figure 12-13 that is potentially useful to both design and test engi-
neers is as follows: Fatigue load responses within the shaded band can be viewed as typical
of the
first-generation
HAWTs in the data set (
e.g.
, many have rigid hubs), and therefore re-
ducing fatigue loads to this level should be readily achievable for future turbines. Responses
Figure 12-13. Correlation of calculated fatigue loads with test data.
Letters designate test
cases.


Search WWH ::

Custom Search