Environmental Engineering Reference
In-Depth Information
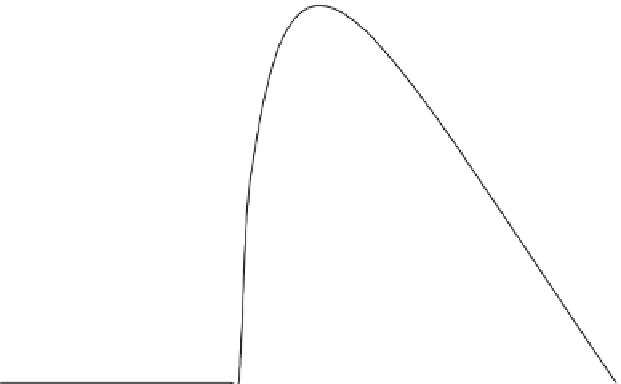
The very large number of cycles at small loads lowers the median flatwise cyclic load
to approximately 2.2 kN-m. A spectrum shape like that in Figure 12-9 can be attributed to
the rainflow counting method that captures blade responses to all levels of wind turbulence.
Because conventional fatigue damage decreases rapidly with decreasing stress, this large
population of very low loads is generally of second-order importance in the calculation of
fatigue life. The total cyclic population is calculated to be 23,700 cycles per hr. Because
the rotor speed during data collection was 55 rpm, the average cyclic rate is calculated to be
approximately 7 cycles per revolution, or 7
P
.
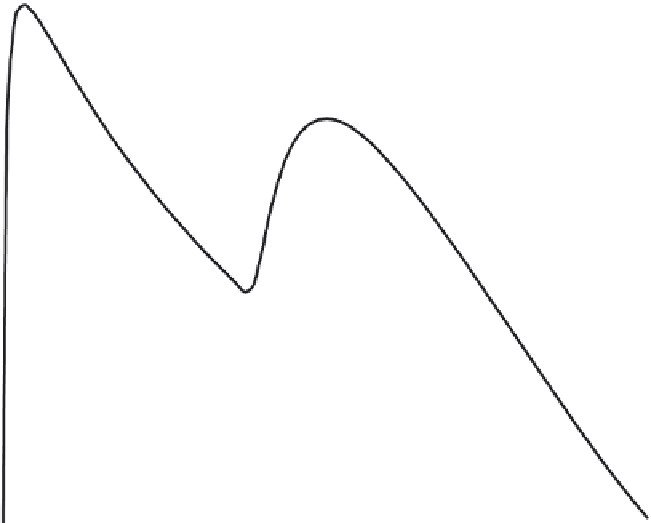
Example 3: Dual-Mode Log-Normal Distribution of Blade
Edgewise Loads
As illustrated in Figure 12-10, the distribution of edgewise cyclic loads on the blades of
the Micon 65/13 LIST wind turbine was found to be significantly different from the flatwise
load distribution. Here we see that there is a large population of cycles at low loads (Mode
1) and a second population centered on a moderately high load (Mode 2). The Mode 1 loads
can be attributed to the blade's random cyclic
torque
response
to wind turbulence, analogous
to the flatwise
flap
response
shown in Figure 12-8. The Mode 2 loads are dominated by the
blade's deterministic response to
gravity loading
, at a rate of one cycle per rotor revolution,
or
1P
.
10,000.00
Log-Normal Distributions,
n'
cycles/hr/bin:
Mode 1
Mode 2
1,000.00
PDF = n'
/0.5 cycles/hr/kN-m
100.00
10.00
1.00
0.10
Measured Spectrum: 20 hr; 501,000 Cycles
0.01
0
5
10
15
20
25
30
35
40
Cyclic Edgewise Blade Load,
L
E
(kN-m)
Figure 12-10. Curve-fitting of a Micon 65/13 wind turbine blade edgewise cyclic load
spectrum with a dual-mode log-normal distribution, and calculation of the related
probability density function.


Search WWH ::

Custom Search