Environmental Engineering Reference
In-Depth Information
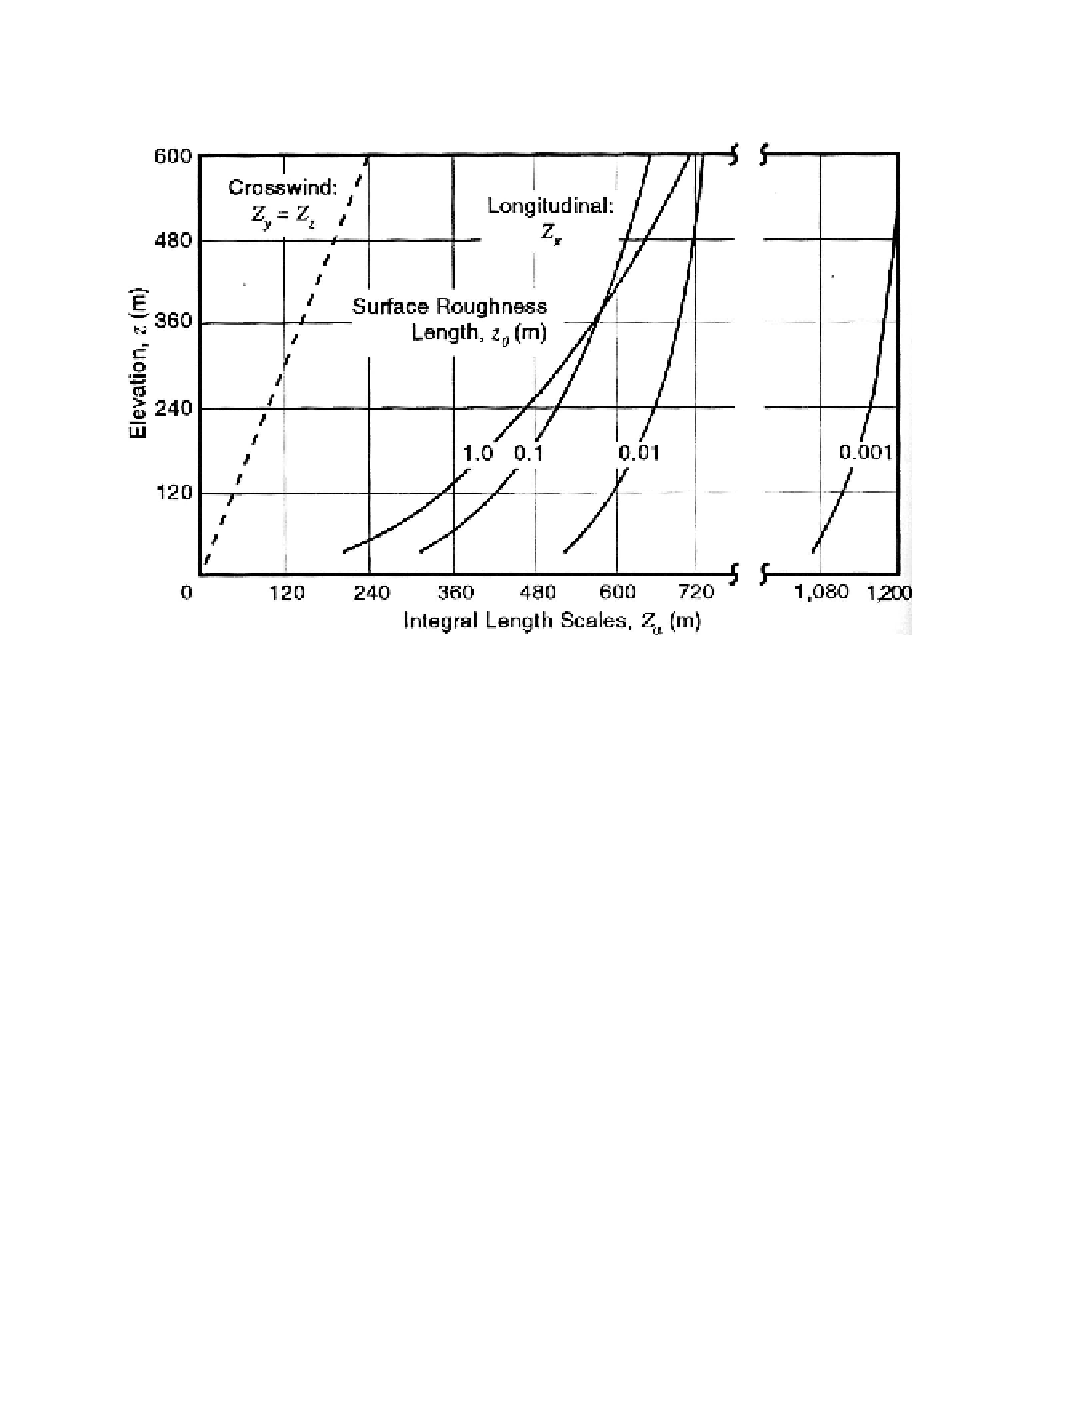
separation distances. Empirical relationships for non-isotropic integral length scales are
plotted in Figure 8-24, as functions of surface roughness length, elevation, and direction
[Counihan 1975].
Figure 8-24. Empirical models for calculating non-isotropic integral length scales.
[Counihan 1975]
Two-Point Spectrum
The correlation coefficient provides a relationship between the fluctuations in the wind
averaged over all values of gust sizes. In many cases, however, the correlation between
fluctuations of a prescribed frequency is needed. In these cases, the statistical parameter
known as the
two-point
or
cross spectrum
is useful. The two-point spectrum is computed
by
Fourier transforms
of the two-point correlation discussed previously. A convenient
theoretical model of the two-point spatial correlation can be derived from the von Karman
model [Houbolt and Sen 1972, Frost
et al.
1987]. The Fourier transforms of these
intermediate two-point correlation equations then gives the two-point spectra.
Coherence
The coherence parameter is defined as the absolute value of the normalized two-point
spectrum, and it is often more useable than the spectrum itself. Coherence is expressed
empirically by Equation (8-21).
Small-Scale Wind Shear Fluctuations
Wind shear fluctuations across the swept area of a wind turbine rotor are another form
of turbulence that can have a pronounced effect on rotor blade loads, fatigue life, and the
output power quality. Ramsdell [1978] established standard deviations and other statistics
Search WWH ::

Custom Search