Environmental Engineering Reference
In-Depth Information
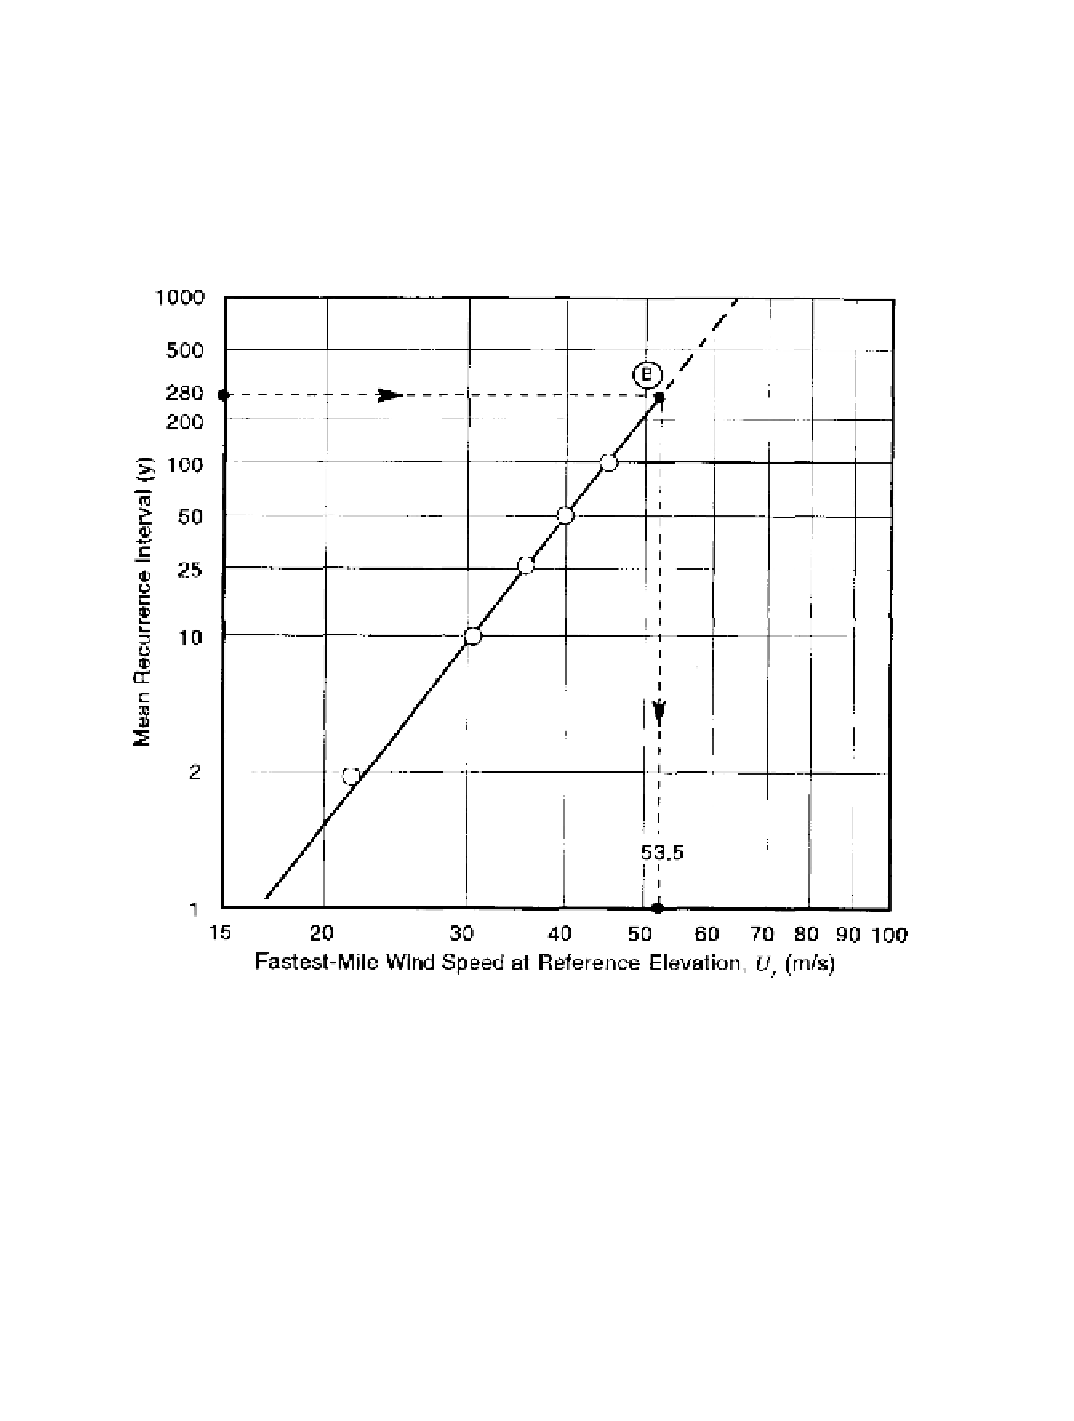
[Thorn 1968], a graph of mean recurrence interval
vs.
fastest-mile wind speed can be plotted
for the reference elevation of 10 m (ignoring the slight difference between 10 m and the 9.1
m elevation of the reference maps), as shown in Figure 8-15. The scales in this figure
follow a
Fisher-Tippet Type II distribution
,
which permits straight-line extrapolation of
available data. For a 280-year interval, the extreme wind speed at 10 m is 53.5 m/s (point
B). The wind shear exponent a
is calculated to be 0.015 from the equations in Figure 8-13
and 0.026 from Equation 8-12. Using the higher value for conservatism, the extreme wind
speed at 61.0 m that meets the design requirements is determined to be 56.1 m/s.
Figure 8-15. Example of a plot of mean recurrence interval
vs.
fastest-mile wind speed,
using Fisher-Tippet Type II distribution coordinates.
[data from Thom 1968]
Detailed computational procedures and data from which basic values of extreme wind
speeds for wind turbine design can be estimated are given in Frost
et al.
[1978], including
mathematical expressions for adjusting these basic speeds for elevation, terrain roughness,
and structural-dynamic response times of different-sized turbine components. Additional
references on extreme wind loads are Hollister [1970], Sachs [1972], Canadian Structural
Design Manual [1975], Simiu and Scanlan [1978], and Mayne [1979].
Search WWH ::

Custom Search