Environmental Engineering Reference
In-Depth Information
The size of the partition probability,
F
p
,
varies somewhat with the level of wind speed
during the run, but for practical speed levels it can be taken equal to 0.75. Thus,
t
p
is the
duration for which 75 percent of the runs are shorter, for a particular site and wind speed
level. Comparison of observed and calculated mean run lengths has shown differences of less
than 10 percent when
F
p
=
0.75, for wind speeds up to roughly 2.0 to 2.5 times the seasonal
mean speed at the site.
To determine recommended values for the shape parameter µ, hourly wind speed
records from 15 sites in the U.S. were analyzed, with a cumulative record length of over
122 years. The shortest observable run duration,
t
0
, was taken as half the sampling period,
or 0.5 h. With the adoption of 0.75 for the partition probability, the fitting of the composite
distribution model to test data reduces to calculating µ from the observed mean logarithm
of the run durations above and below selected wind speeds or
run levels.
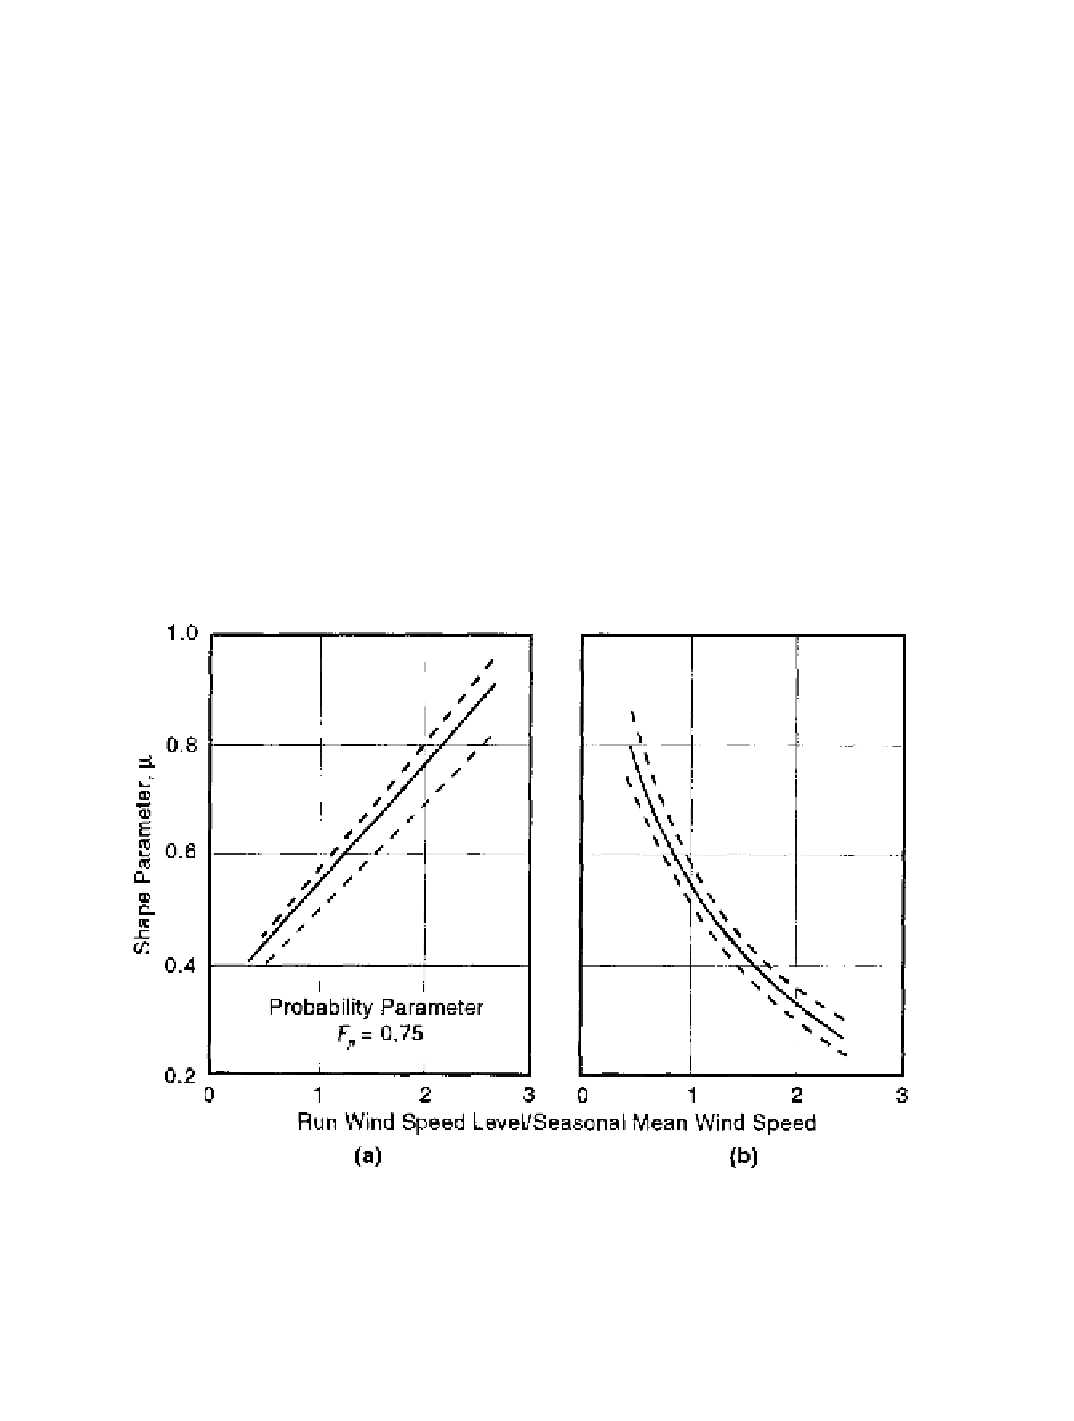
A high degree
of correlation between the shape parameter and the run level was found when the run lev-
el was normalized by the seasonal average wind speed. Figure 8-9 shows the results of
this analysis in the form of curves of µ
vs.
wind speed ratios, with scatter bands of ± one
standard deviation indicated.
The parameter values given in Figure 8-9 are considered to be adequate for wind
turbine design purposes when only the seasonal average wind speeds are known. If a
complete persistence analysis is available, best-fit values for the parameters
F
p
and µ can
be selected.
Figure 8-9. Recommended parameters for the composite persistence probability model,
derived from wind speed records at 15 U.S. sites.
Bands indicate ± one standard deviation
of scatter, (a) Runs with wind speeds above a selected run level (b) Runs with wind speeds
below a selected run level [Sigl
et al.
1979]
Search WWH ::

Custom Search