Environmental Engineering Reference
In-Depth Information
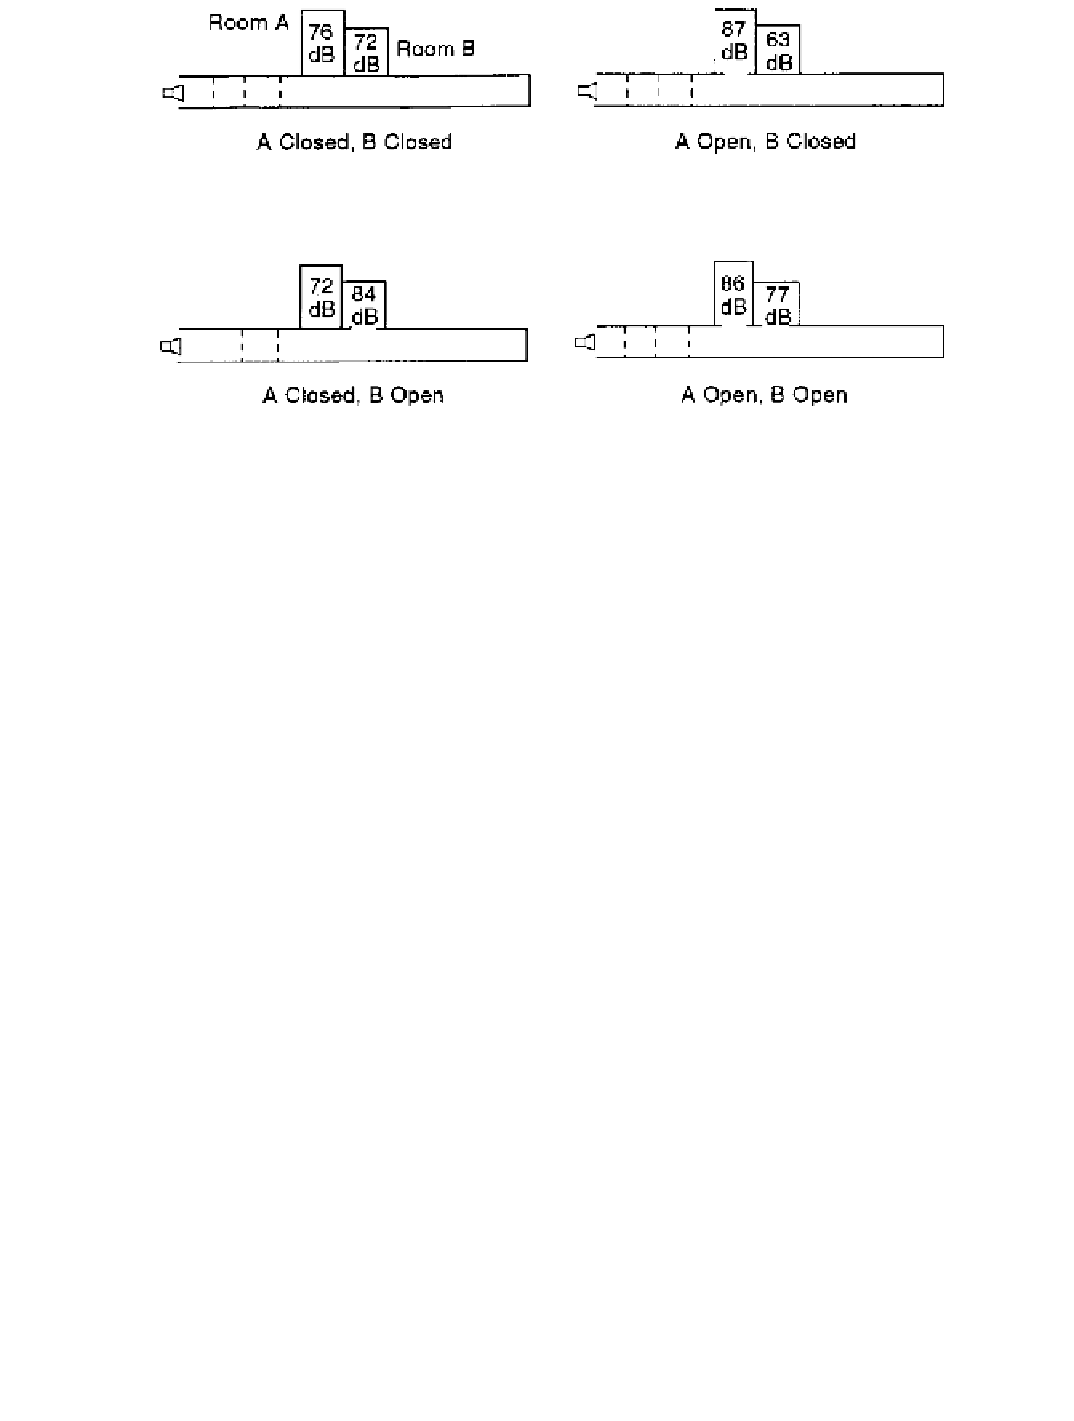
Figure 7-38. Effect of door positions on the maximum sound pressure levels in rooms
adjacent to a hallway excited by a loudspeaker at 21 Hz.
[Hubbard and Shepherd 1986]
Figure 7-38 illustrates the manner in which these changes can occur for various door posi-
tions. Variations in sound pressure level are as high as 20 dB for a steady noise input, both
inside the rooms and in the hallway, as shown previously in Figure 7-37. This implies that
a person might experience a change in levels of this order of magnitude at a particular
location, depending on the doors, or as a function of location for a particular door
arrangement. During tests, the highest sound pressure levels of Figure 7-38 could be readily
heard, but the lowest levels were not audible.
Mechanical coupling between adjacent rooms can also excite acoustic resonances, as
indicated by data in Hubbard and Shepherd [1986]. One wall of a test room was mechani-
cally excited, and two response peaks were noted. One peak corresponded to the Helmholtz
mode of the room, and the other was the first structural mode of the wall. Measured sound-
pressure-level gradients were small in both cases.
Perception of Building Vibrations
One of the common ways that a person senses noise-induced excitation of a house is
through structural vibrations. This mode of observation is particularly significant at low fre-
quencies, below the threshold of normal hearing.
No standards are available for the threshold of perception of vibration by occupants of
buildings. Guidelines are available, however, that cover the frequency range from 0.063 to
80 Hz [Hubbard 1982, ISO 1987]. The appropriate perception data are reproduced in Fig-
ure 7-39. The hatched region in this figure shows the perception threshold data obtained
in a number of independent studies. Different investigators, using different measurement
techniques, subjects, and subject orientations, have obtained perception levels extending over
a range of about a factor of 10 in vibration amplitude. The composite guidelines of Figure
7-39 are judged to be the best representation of the most sensitive cases from the available
data on
whole-body vibration perception.
The two small shaded regions in Figure 7-39 are from the data of Kelly
et al.
[1985].
These are estimates of levels of vibration perceived in two different houses excited by noise
Search WWH ::

Custom Search