Environmental Engineering Reference
In-Depth Information
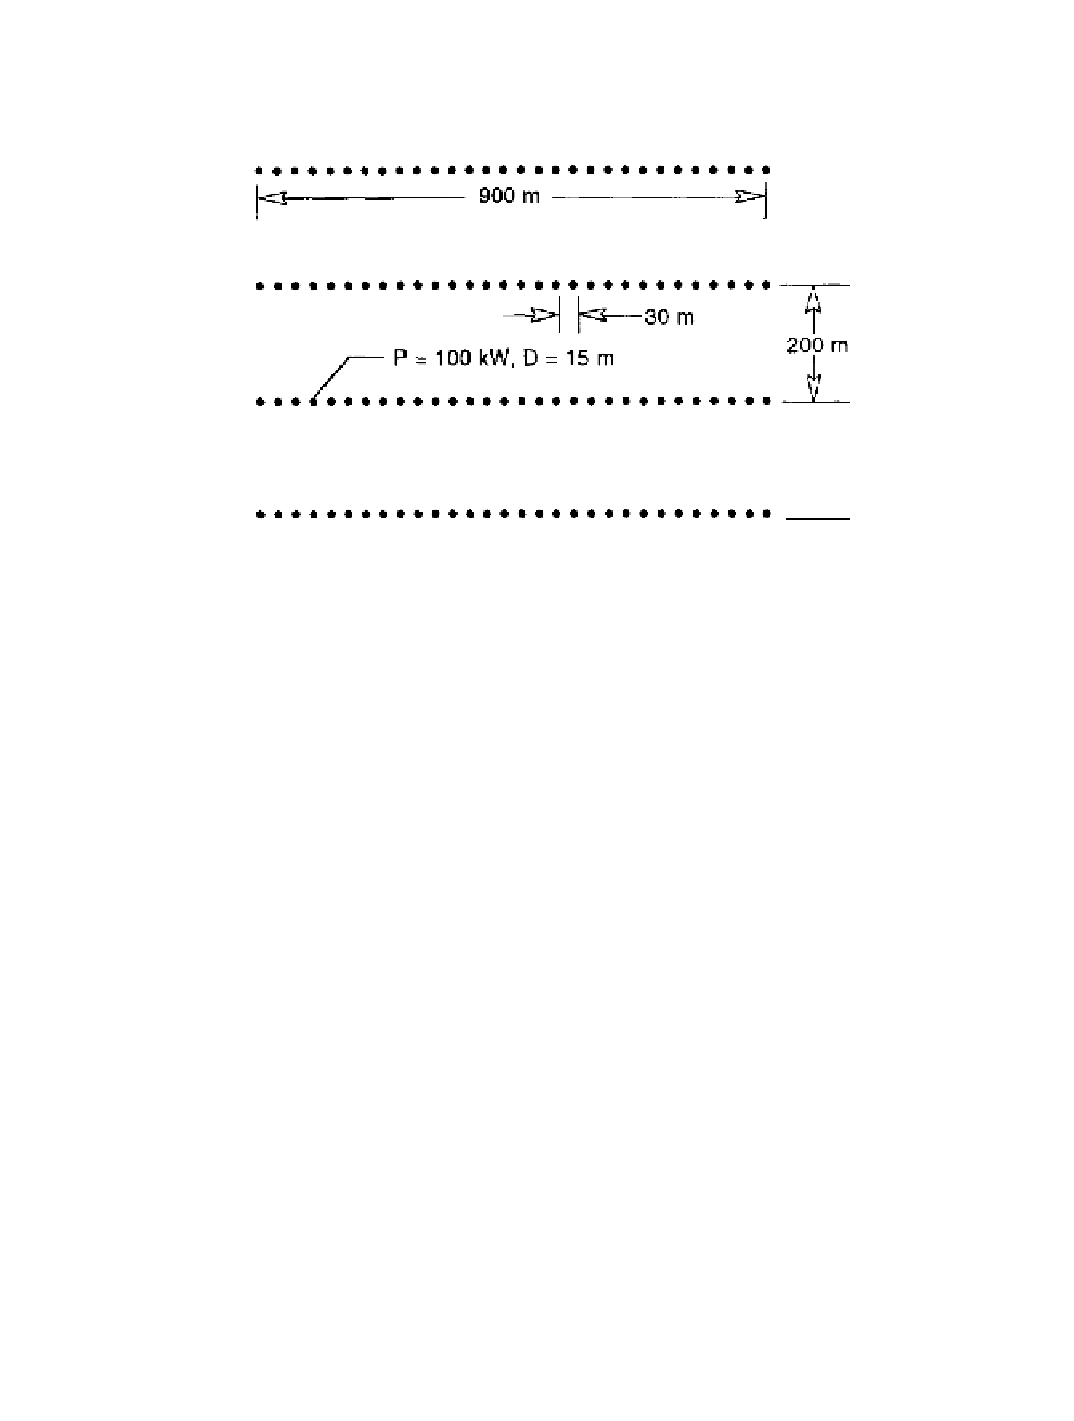
Figure 7-25. Layout of 124 wind turbines in an representative wind power station.
[Shepherd and Hubbard 1986]
tion
can be perturbed to investigate the effects of such variables as the number of rows, row
spacing, turbine spacing, row length, and turbine power rating.
Absorption and Refraction
The example calculations that follow assume an ambient temperature of 20° C and a
relative humidity of 70 percent. From the data in Figure 7-19, assumed values of atmospheric
absorption of 0, 0.10, 0.27, and 0.54 dB per 100 m then correspond roughly to one-third-
octave band center frequencies of 50, 250, 500 and 1,000 Hz, respectively. These
frequencies were chosen because they encompass the range of frequencies considered
important in evaluating the perception of wind turbine noise in adjacent communities
[Shepherd and Hubbard 1986].
Calculation Methods
The method presented here for calculating the sound pressure level from incoherent
addition is a sum of the random-phase multiple noise sources at any arbitrary receiver
distance. This method assumes that each source radiates equally in all directions, and
attenuation caused by atmospheric absorption is included. Propagation is over flat,
homogeneous terrain, and there is a logarithmic wind-speed gradient. The method has no
limitations on the number of wind turbines or their geometric arrangement.
The required input is a reference sound-pressure-level spectrum,
L
0
(
f
),
either narrow-
band or one-third-octave band, for a single wind turbine. This spectrum can be either
measured or predicted, and should represent the radiated noise at a reference turbine-to-
receiver distance of approximately 2.5 times the rotor diameter. The sound pressure level
Search WWH ::

Custom Search