Environmental Engineering Reference
In-Depth Information
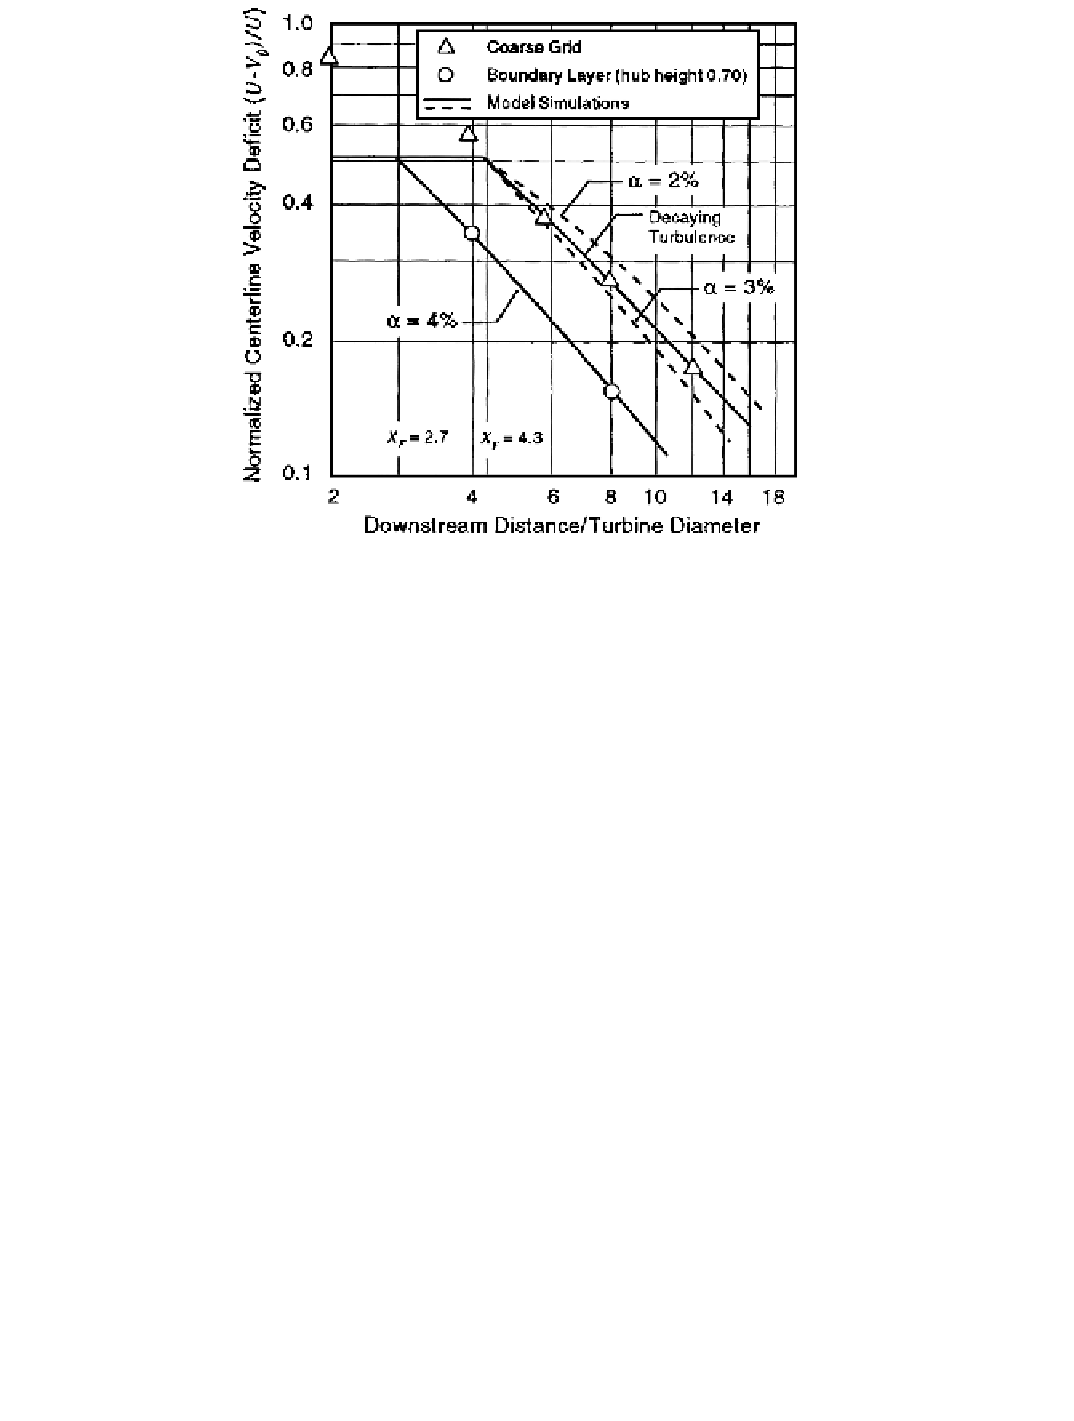
Figure 6-18. Comparison of wind tunnel test data and model predictions of the decay in
wake velocity deficit.
Field Tests on a Single Turbine
Comprehensive field tests of the individual factors that cause array interference are
extremely difficult to conduct. It is necessary, in principle, to check the different effects
separately. These include at least the wake development (velocity deficit, wake radius,
and turbulence) downwind of a single turbine as well as the performance of a downwind
unit while experiencing wake flow. Further refinements in field testing would include
measurements on the wake of one turbine operating within the wake of another. Certain
fundamental features of the nature of wind turbine wakes have been established by full-scale
field tests. The results of measurements by Faxen [1978] of the velocity profile behind an
operating HAWT are shown in Figure 6-19 and confirm the expected, approximately
Gauss-
ian
profile of the deficit in the far wake.
We can extract some additional information about HAWT rotor wakes from the data
in Figure 6-19 if we integrate the deficit volumes under the two profiles and normalize the
results. Table 6-4 lists various parameters obtained by this procedure. We note that the ratios
of deficit-to-wind speed are not constant for the two test cases, but increase with increas-
ing power. The normalized parameters that are found to be approximately equal for the two
cases are the average-to-centerline deficit ratios (0.28, compared to 0.22 for an ideal Gaussian
distribution), and the deficit-to-power density ratios. The latter are approximately 0.042 (m/
s)/(W/m
2
) for the average deficit and 0.0142 (m/s)/(W/m
2
) for the maximum.
Search WWH ::

Custom Search