Environmental Engineering Reference
In-Depth Information
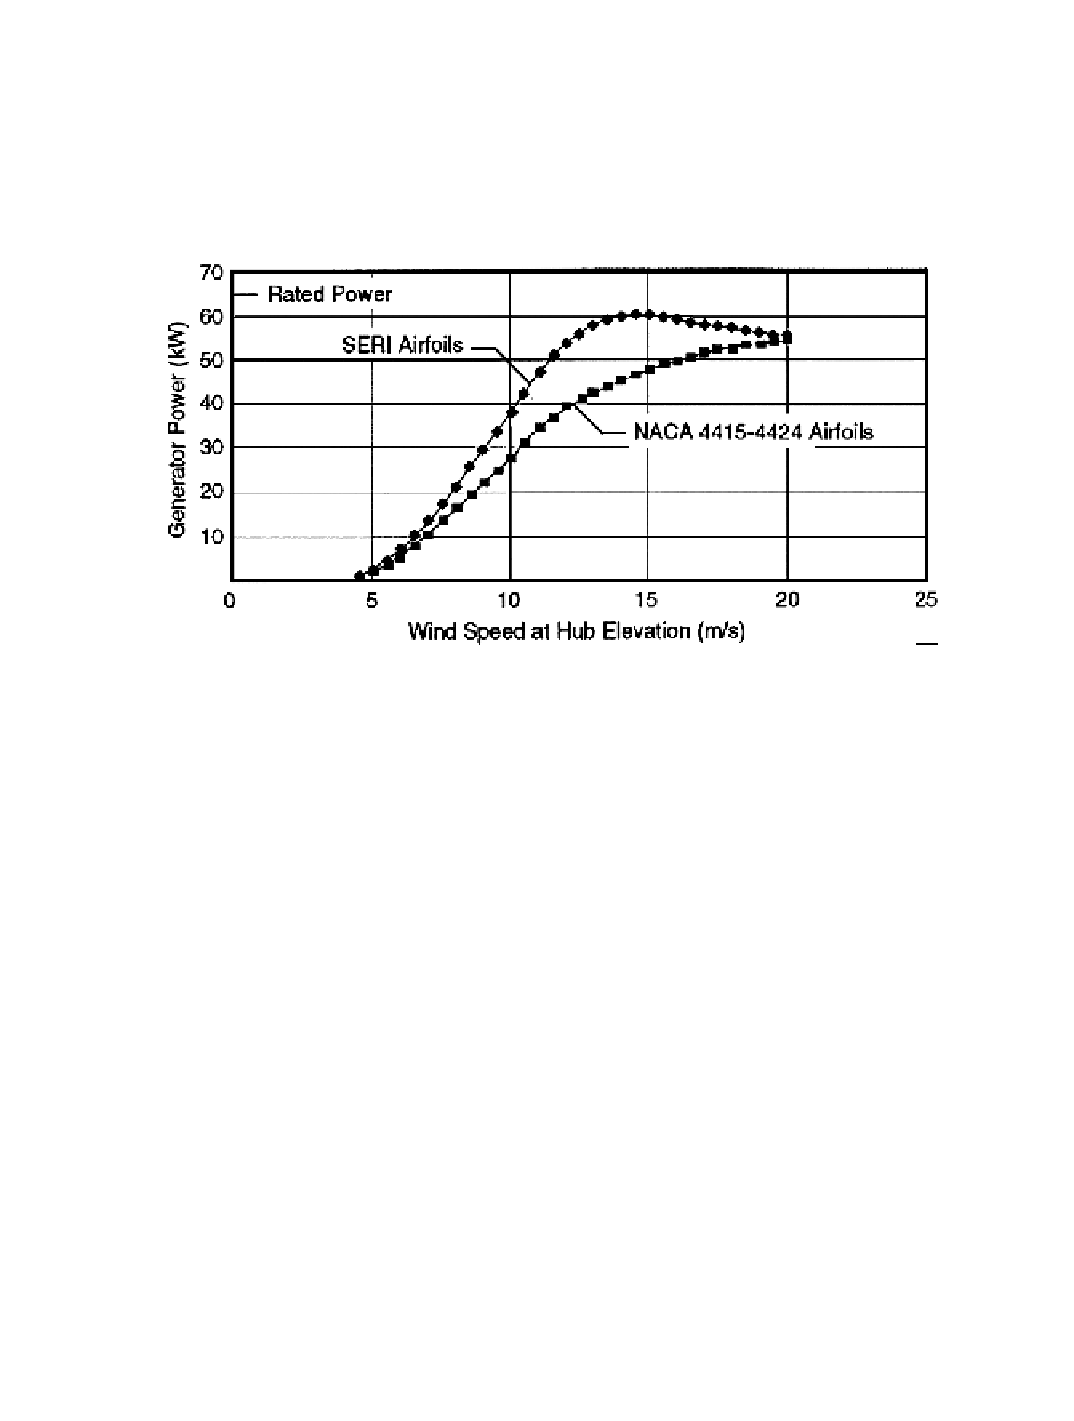
Figure 6-12. Power curves from field tests of dirty blades.
[Tangler
et al.
1990]
Comparative Energy Production
Comparative
annual energy outputs
are calculated by combining power curves, such
as those in Figures 6-11 and 6-12, with a specified
wind speed histogram
,
as illustrated by
the example in Table 5-1. Tests on wind turbines conducted in accordance with standard-
ized ASME procedures [ASME 1989] seek to define relative energy production in terms of
an
annual energy ratio
,
which is the ratio of the annual energy output of the test turbine to
that a specified reference energy production. The latter could be a calculated value (
e.g.
during the design phase) or the result of previous tests.
To illustrate performance comparisons on the basis of annual energy ratios, we will
assume (1) the clean original rotor is our reference, and (2) the annual wind speed histo-
gram has a
Weibull distribution
with parameters
C
= 8.51 m/s and
k
= 2.48. The latter are
taken from Table 2-1 for an elevation of 25 m, the entry nearest the 23-m hub elevation of
the Micon 65/13 HAWTs. Table 6-3 lists the results of annual energy calculations obtained
using this wind histogram and the power curves in Figures 6-11 and 6-12.
Search WWH ::

Custom Search