Environmental Engineering Reference
In-Depth Information
Early wind turbine field testing aimed at understanding rotational augmentation affirmed
the importance of blade geometry with respect to rotational influences [Madsen and Chris-
tensen 1990]. A wind tunnel experiment showed that blade geometry coupled with blade
rotation maintained blade lift under conditions in which lift otherwise would significantly
decline [Barnsley and Wellicome 1992]. Subsequent wind tunnel research determined that
rotational augmentation was most active at the inboard portion of the turbine blade [Ronsten
1992]. Analytical modeling of rotational augmentation furnished better comprehension of
the aerodynamics underlying this phenomenon, and provided foundational predictive capa-
bilities for design and analysis [Eggers and Digumarthi 1992, Snel
et al.
1994, Du and Selig
2001; Corten 2001, Tangler and Selig 1997, Corrigan and Schillings 1994].
Inboard Locations on Turbine Blades
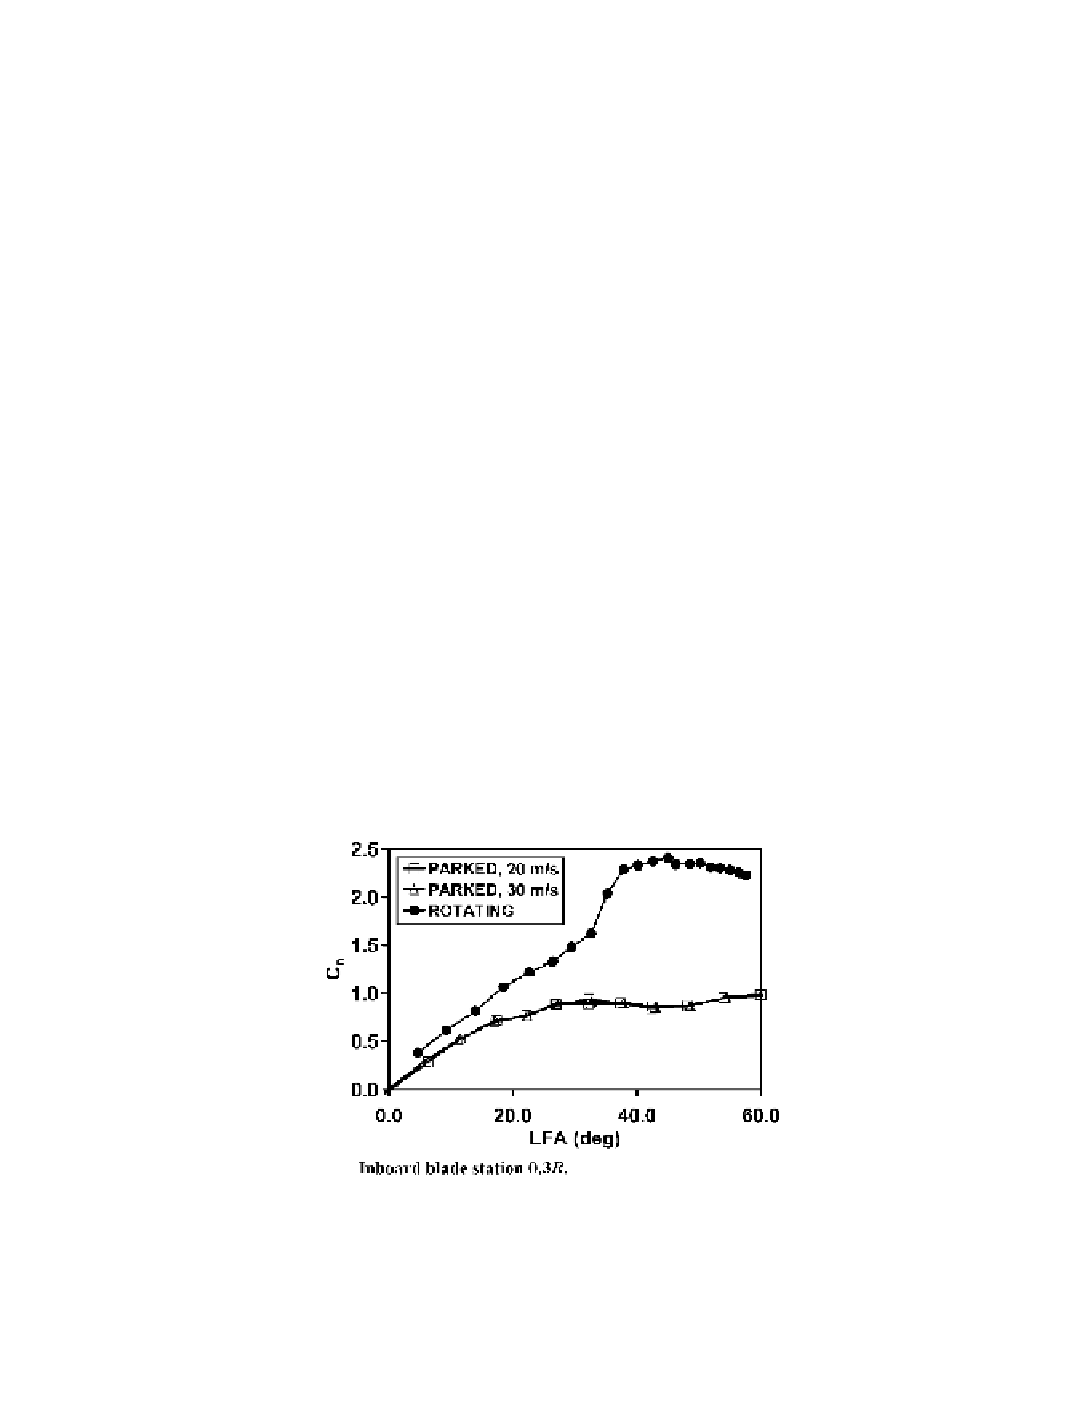
As shown in Figures 5-46 and 5-47, inboard radial locations exhibit rotational augmen-
tation more strongly than do radial locations farther outboard on the blade. In Figure 5-46,
C
n
at 0.30
R
is plotted as a function of
LFA
, for both the stationary (parked) and rotating UAE
Phase VI blade with its NREL S809 airfoil. All data correspond to an axisymmetric operat-
ing state, with the rotor plane normal to the wind vector.
With the blade held stationary and a free-stream wind speed,
U
¥
, equal to 20 m/s, the
Reynolds number,
Re
, at station 0.30
R
equals 0.98 x 10
6
. At a
U
¥
of 30 m/s Re equals 1.46
x 10
6
. These Reynolds numbers encompass the range for the 11 fastest rotating blade data
points, thus establishing a consistent baseline against which the rotating blade data can be
compared. For the stationary blade,
C
n
increases progressively with
LFA
, reaches a relative
maximum of 0.94 at
LFA
= 32.2°, and thereafter remains approximately level.
To disclose hysteresis effects, if any, the stationary blade normal force curve for each
wind speed consists of two data sets: One corresponding to increasing
LFA
, and the other for
decreasing
LFA
. These two curves exhibited close agreement, testifying to the absence of
hysteresis effects for stationary operation, and disqualifying hysteresis as an explanation for
rotational augmentation.
Figure 5-46. Comparison of sectional normal force coefficients,
C
n
,
at an inboard sta-
tion for stationary (parked) and rotating operations of the UAE Phase VI wind turbine,
as functions of the local inflow angle,
LFA
.
Differences between rotating and stationary
C
n
values were all consistently larger for inboard locations
Search WWH ::

Custom Search