Environmental Engineering Reference
In-Depth Information
Comparison of Theoretical VAWT Performance with Test Results
Theoretical predictions of the performance of the
Sandia/DOE 17-m VAWT
(similar to
that in Fig. 3-24) will now be compared with measured performance data [Worstell 1980].
The principal parameters of the Darrieus rotor on this machine are as follows:
Airfoil = NACA 0015; lift and drag data from [Sheldal and Klimas 1981]
R
= 8.28 m (at
z
= 0)
c
= 0.61 m
H
= 17.0 m
A
= 183 m
2
B
= 2
W = 4.0 to 5.3 rad/s
N
R
= 1.5 to 2.0 ´ 10
6
at the rotor equator
r
= 2.790 + 30.100 -
z
2
0 £ |
z
| £ 4.548
m
r
= 12.60 - 1.4826 |
z
| 4.548 £|
z
| £ 8.090
m
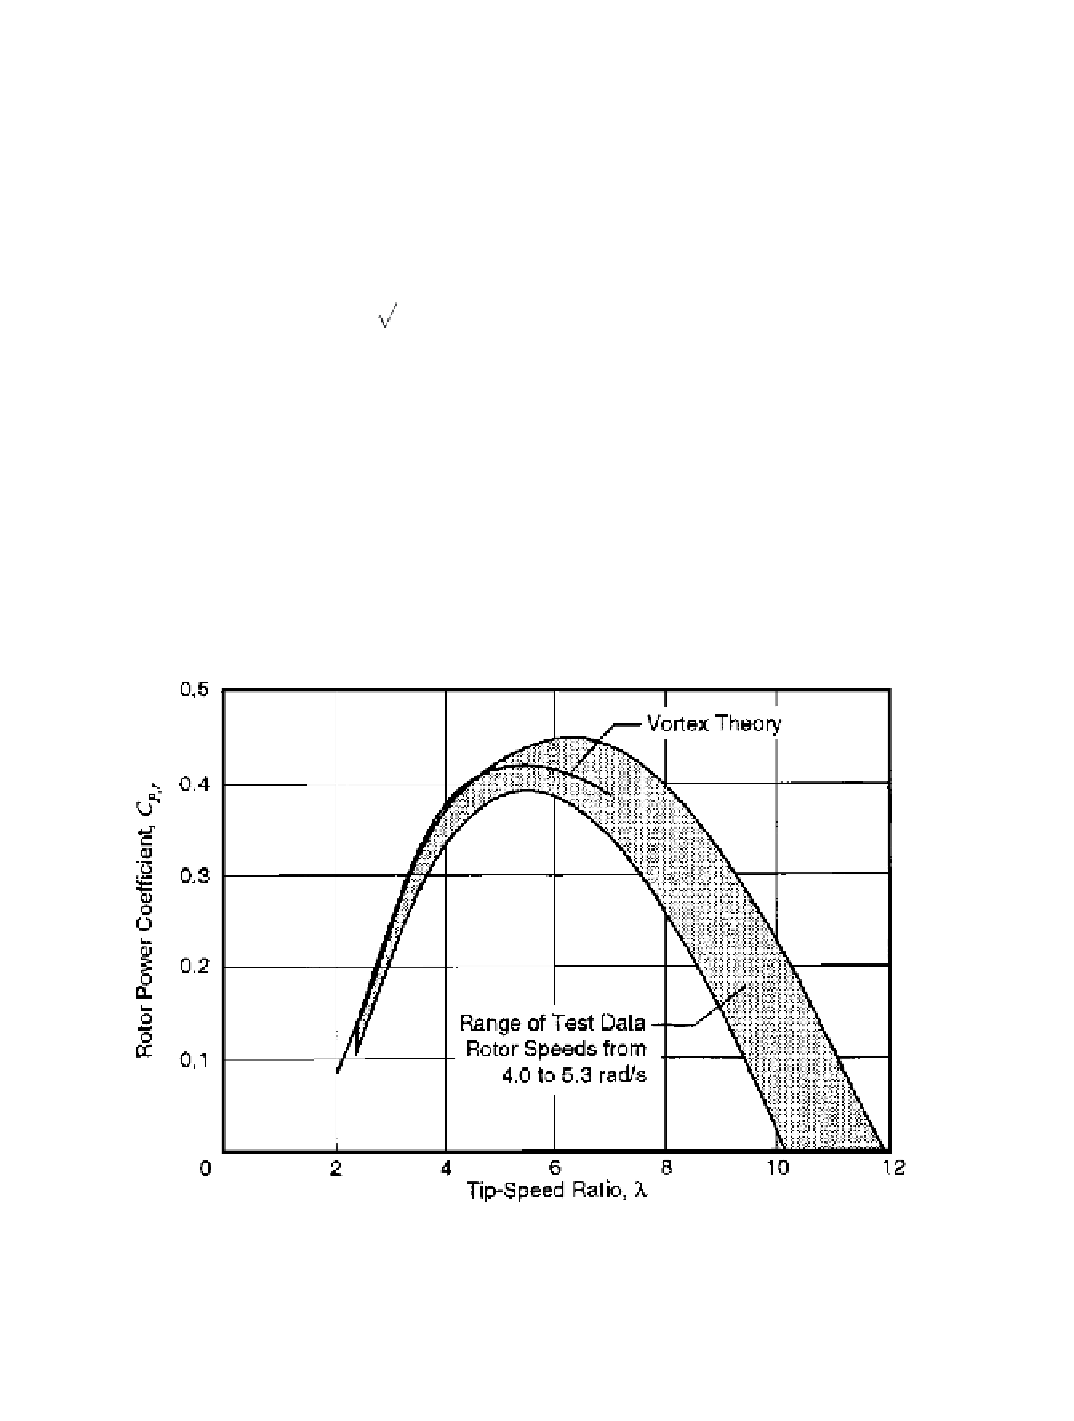
Test power coefficients are plotted versus tip-speed ratio in Figure 5-37, together with
vortex-model predictions [Strickland
et al.
1979]. It can be seen that this type of aerodynam-
ic model is quite accurate. However, since an aerodynamic analysis based on vortex theory
is the most complex and time-consuming of the methods for predicting VAWT performance,
it is generally reserved for validating simpler models.
The test data and vortex theory predictions in Figure 5-37 are plotted in a dimensionless
power-curve form in Figure 5-38, as rotor-speed power coefficient,
K
P
,
vs.
advance ratio,
J
. We note that the region of maximum power coefficient (
J
» 0.18 or l » 5.5) occurs at
low power levels, indicating that
C
P
, max
is not a critical parameter in determining the annual
Figure 5-37. Comparison of experimental and theoretical power coefficients for the
Sandia/DOE 17-m VAWT.
Test data from [Worstell 1980]; theory from [Strickland
et al.
1979]
Search WWH ::

Custom Search