Environmental Engineering Reference
In-Depth Information
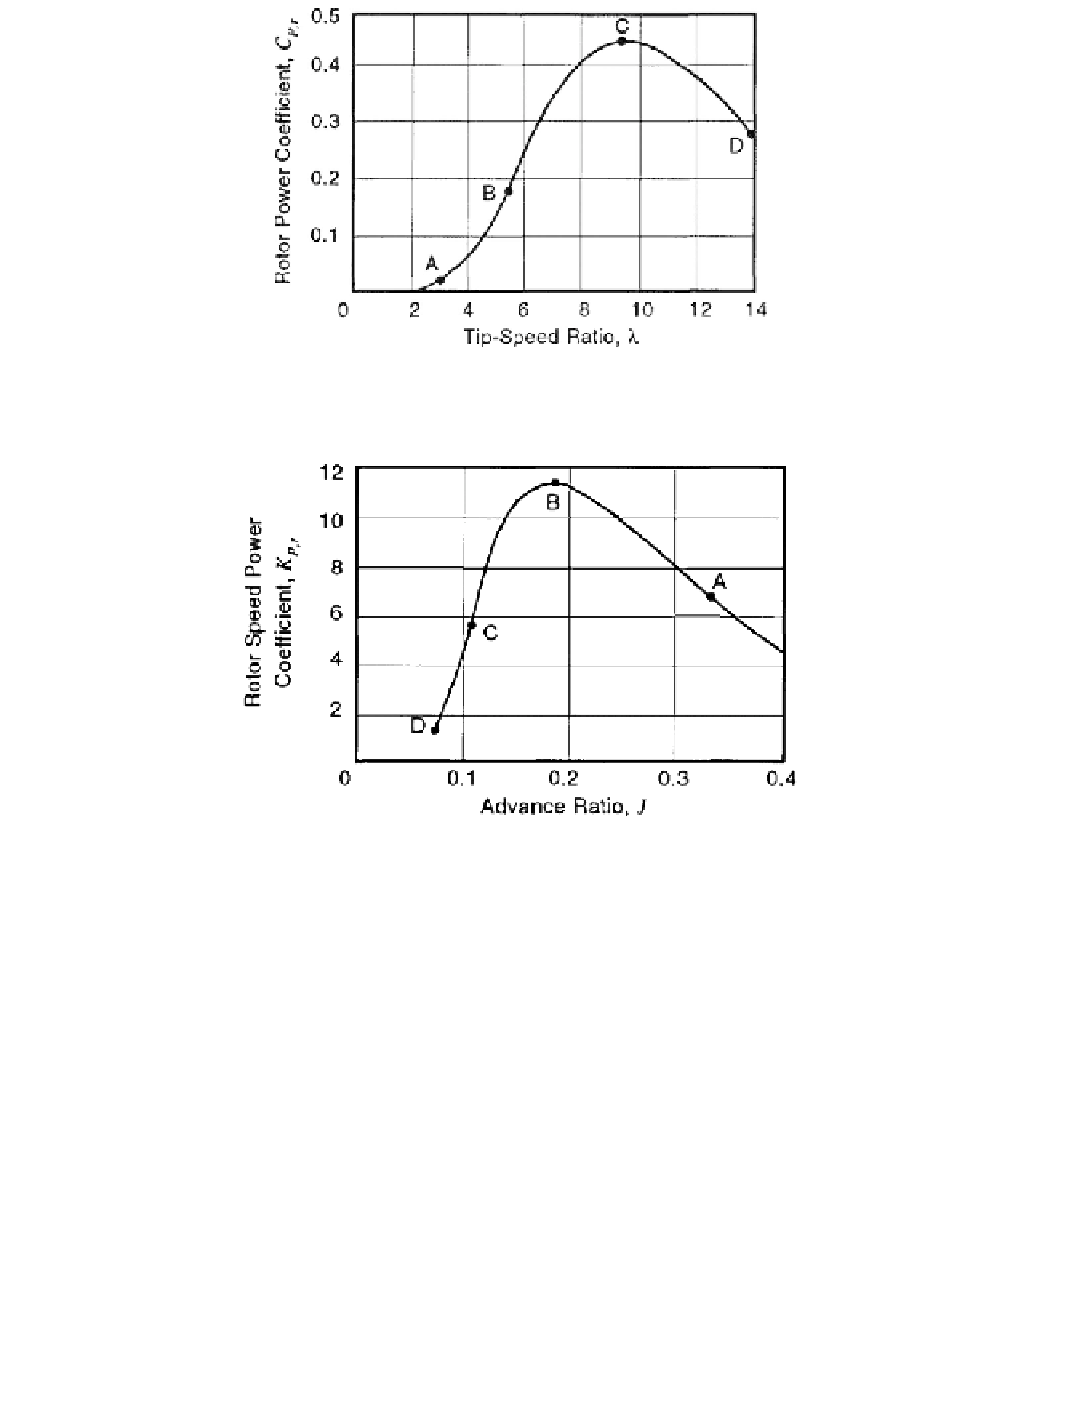
Figure 5-5. Typical plot of rotor power coefficient
vs
. tip-speed ratio for a HAWT
with a fixed blade pitch angle
.
Figure 5-6. Rotor speed power coefficient
vs
. advance ratio for the same HAWT.
Operating points A, B, C, and D are the same as in Figure 5-5.
Annual Energy Output
One of the most significant measures of the cost-effectiveness of a wind turbine is its
annual production of energy. In the design and analysis of wind turbines, the
annual energy
output
is calculated as illustrated by the flow chart in Figure 4-35. All of the steps in this
process are normally the responsibility of the aerodynamic specialist. Calculation of annual
energy output requires knowledge of the
wind speed frequency distribution
(probability that
the wind speed will be within a given range) and the system power output of each turbine
as a function of wind speed. Furthermore, every prediction of annual energy output is site-
specific, depending on the local wind flow patterns and turbulence, the number and type of
neighboring turbines, and the local air density.
The frequency distribution required is that of the wind speed at the elevation of the cen-
ter of the rotor's swept area (
hub elevation
in a HAWT or
equatorial elevation
in a VAWT) at
the site where the annual energy output is to be determined. When this frequency distribution
is obtained from anemometer test data, it is frequently expressed in the form of a
histogram
,
Search WWH ::

Custom Search