Environmental Engineering Reference
In-Depth Information
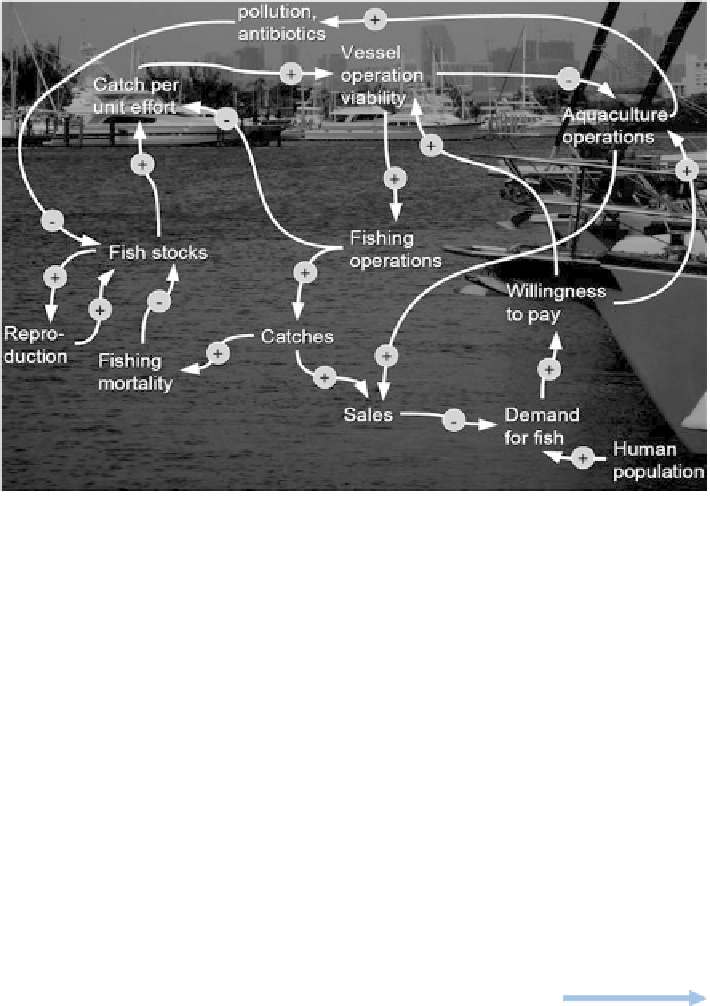
Fig. 4.1 Example of a cause-effect diagram describing relations in coastal fisheries. Explanations
of which criteria are used to set-up a cause-effect diagram are given in the text
components interactions. Other modelling approaches go specific ways in successive
refinement. The additional achievement of the flow diagram is, that a graphical
overviewmakes it easier to survey larger networks and follow quantitative transitions
within the model. The flow chart approach was originally popularized by Forrester
(1968) in the context of the simulation package “DynaMo”. Later, the approach
became modified in different ways and was used also as a graphic user interface in
various simulation software (e.g. STELLA, ModelMaker, SIMILE, see
http://www.
mced-ecology.org
). This links the conceptual development of a model with computer
implementation. The flow diagram consists of the following major components:
l
Compartments
Compartments are containers to store material, energy, or any kind of quantity in
focus. They represent a variable (element) of a dynamic system. Compartments are
drawn as rectangles.
l
Connections
Connections are drawn as solid arrows. They represent the flow of the quantities
between the compartments. A flow always occurs in a dynamic system when the
size of a variable changes. An increase is considered as an inflow to the variable, a
decrease as an outflow. The flow can come from or go to other compartments, or