Environmental Engineering Reference
In-Depth Information
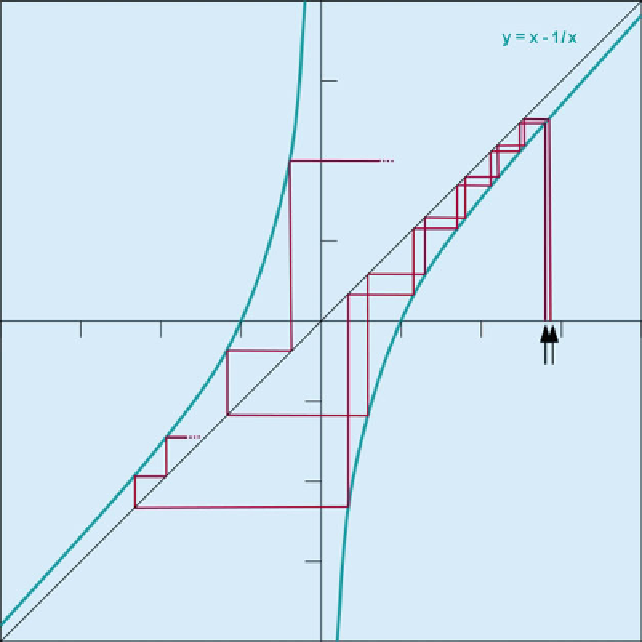
Fig. 1.2 Graphical iteration of the function
y
x
- (1/
x
). The
arrows
show two initially
close starting values. For iteration, the starting value is drawn towards the function line. To obtain
the next iteration, the determined value is connected to the diagonal (where
y
and the according
x
-value equate) and again move to the function. It can be seen, that initially small intervals become
successively expanded. Initial correlations tend to get weaker and get successively lost. This is a
characteristic feature of what is called deterministic chaos
¼
x
suc
¼
Complexity in a Simplistic Ecosystem Model
In ecological modelling it is often discussed to what extent an ecosystem model can
be simplified. An extreme simplification is putting all biomass into one big box (Y)
and distinguishing only growth (biomass production) and decay (decomposition,
re-mineralization). Growth could be simplified as a constant increase of an amount
C
1
. The decrease will be simplified as the vanishing quantum of an amount
proportional to the current amount of Y with C
2
as a proportionality factor. We
decide for a step-wise operation with either biomass growth or decay occurring in
each step. If the biomass Y exceeds a threshold value (
1 for simplicity), decom-
position is operated, otherwise increase occurs. This yields the form:
þ