Environmental Engineering Reference
In-Depth Information
spatial structures as a result of the interactions of the model components. The
type of pattern depends largely on the combination of the involved movement
processes. In the following, we will elucidate some of the characteristic emerging
patterns.
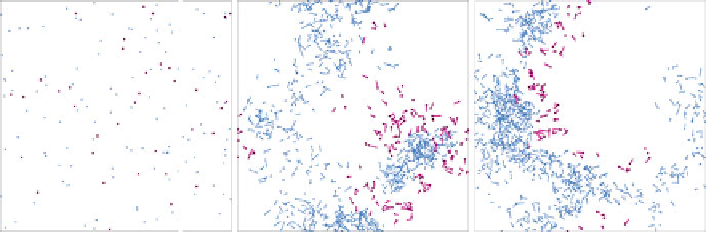
In the first example prey and predator individuals both move according to a
random walk. As a consequence, after the initial random distribution prey and
predators exhibit a spatial segregation. The population of the predators can only
grow in the proximity of the area which is dominated by the prey. As the predator
aggregations successively shift towards the prey areas, spatial dynamics result in a
kind of travelling wave pattern (see also Sect. 8.4) that involves both prey and
predator individuals (Fig.
12.2
).
The second example (Fig.
12.3
) illustrates the results when the prey exhibits a
Brownian (random) movement, whereas the predators move according to a corre-
lated random walk. This scenario leads to a remarkable aggregation of the prey. We
find temporarily stable prey clusters with roaming predators which rarely meet a
cluster while roaming the overall area. The predators can feed during a few time
steps when passing a prey cluster, however will leave it again because they maintain
the momentum of their movement.
When all other factors remain unchanged (i.e. ceteris paribus condition), the
degree of autocorrelation, which is represented in the value for directedness of the
predator movement, is the key factor that enables transferring one class of spatial
pattern (travelling wave phenomenon) into another (random distribution, see
Turchin 1998). Also, further variations of different movement factors that can be
specified over the parameter file between prey and predators lead to different
spatial distribution patterns.
Fig. 12.2 Simulation results of the IPP model simulating a simple individual-based predator-
prey interaction.
Points
indicate the current positions of prey and predators, the
line
shows the
movement from the previous position.
Lighter shades
and
smaller points
indicate the prey,
darker
and
larger points
indicate the predator.
Left
: The initial distribution is random.
Center
:
After 200 time steps - if both types of organisms move randomly, according to a Brownian
movement, a characteristic spatial self-organization occurs. After the initial phase a dynamic
change of border structures occurs where predator and prey interaction is highest.
Right
: After
400 time steps