Environmental Engineering Reference
In-Depth Information
Potentiostat
I
E
I
L
I
1/2
E
1/2
I
Reference electrode
E
Working electrode
Counter electrode
Stirring device
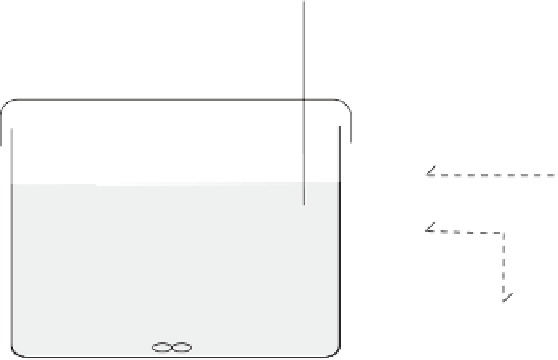
Figure 11.2
Schematic diagram of a voltammetric cell
from each other primarily by the potential function that is applied to the indicator
electrode to drive the reaction and by the material used as the indicator electrode.
The general principles of voltammetric analysis are as follows. As the potential
is applied, the electrolysis of an analyte (redox reaction) begins and the current rises
rapidly until it reaches the limiting current. This resulting plot of I vs. E is called
voltammogram. The limiting current is defined as the difference between the
background current and the plateau current. The midpoint of the rise (and the point
of maximum slope) is termed the half-wave potential (E
1/2
), which is a characteristic
of the redox reaction of the analyte and can be used for qualitative analysis. For
quantitation, the amount of limiting current that is measured is related to the
concentration (C) of the analyte according to
I
L
¼ kC
ð11
:
9Þ
where I
L
is a limiting current, and k is a constant under specific conditions. When k is
constant for a series of standard solutions of various concentrations and an unknown,
a calibration plot can be constructed and the unknown concentration can be
determined.
Conductometry
Conductometry measures conductance or conductivity, which is related to the ability
of a solution to carry an electric current while a constant alternating-current (AC)
potential is maintained in a conductivity cell. The concepts of conductance and
conductivity have been described in Section 10.3.3, when ion chromatography
detector was discussed. The conductivity cell has two plates (or electrodes) placed in


Search WWH ::

Custom Search