Image Processing Reference
In-Depth Information
(bot-
ng a
natal
The
Truth
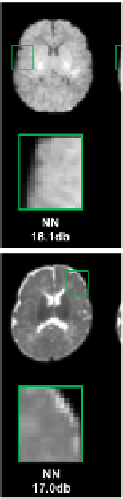
Fig. 4.
Reconstruction results
tom row) from different subje
low-resolution neonatal image
image was simulated from re
reconstructed high-resolution
image and their SNR were pro
for a neonatal T1 image (top row) and a neonatal T2 image (
ects. In each row, the left panel shows input images includin
e and its 2-year-old follow-up image. The low-resolution neon
al images (Fig. 3) showing at right panel tagged as Truth.
images from different methods were compared with the T
ovided measuring reconstruction performance.
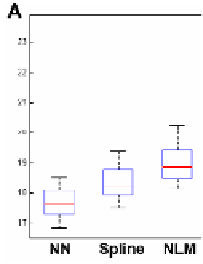
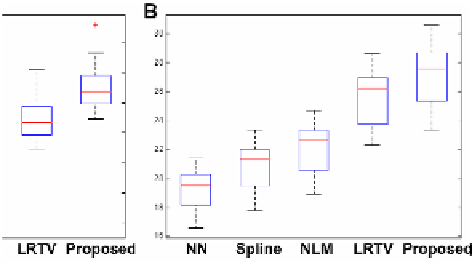
nstruction of 28 neonatal images using (A) T1 images and (B)
significantly outperforms all other methods (p<0.01).
Fig. 5.
SNR boxplots for recon
images. The proposed method
) T2
Quantitative results for
Fig. 5. Similar to the obse
from NN, spline, NLM, L
achieved the highest SNR
relatively lower SNR than
T1 and T2 reconstructions of 28 infants are shown
ervations from Fig. 4, Fig. 5 indicates that SNR increa
LRTV, to the proposed method. The proposed meth
among all methods (p<0.01). Note that T1 images g
T2 images, which may be due to the fact that T1 ima
n in
ases
hod
give
ages


Search WWH ::

Custom Search