Image Processing Reference
In-Depth Information
i
and
E
ij
is the error for time
have mean zero and constan
Two models with the
age3*sex) were computed t
for the patient group. Tw
computed for the NC and N
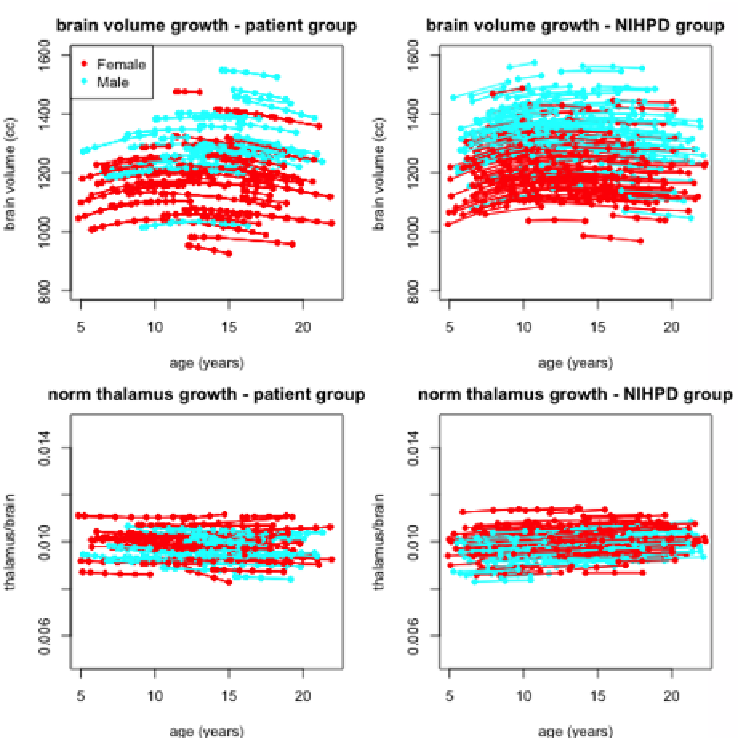
The brain and normalize
subjects are represented Fig
e point
j
in subject
i
. The errors for subject
i
are assumed
nt variance and be independent of the vectors (ʳ
0
i
, ʳ
1
i
).
same fixed effects (age, age2, age3, sex, age*sex
to estimate brain growth and normalized thalamus grow
o other brain and normalized thalamus models were a
NIHPD groups.
ed thalamus growth trajectories of all patients and NIH
g. 2.
d to
and
wth
also
HPD
Fig. 2.
Model fits of the brai
curves (bottom) for the patient
n volume growth curves (top) and normalized thalamus gro
ts (left) and the normal controls from NIHPD (right)
owth
3.2
Growth Rate and V
Volume z-score Group Comparison
Figure 3 represents an exam
tion for a 15 yo patient: bra
mple that illustrated the four steps of the z-score compu
ain volume computed at 7 visits (green curve in (a)), br
uta-
rain
Search WWH ::

Custom Search